
Furuno NN3D, now with C-Maps by Jeppesen
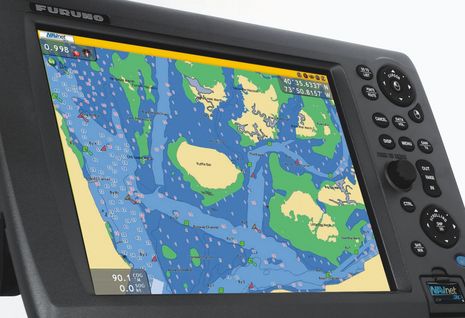
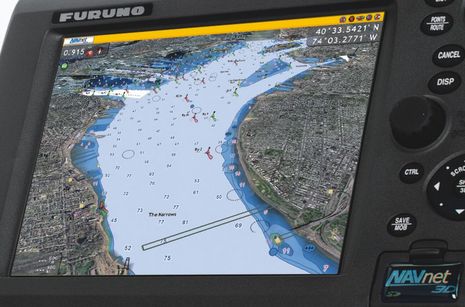
When MaxSea bought Nobeltec from Jeppesen last Fall, there were hints that one somewhat counter-intuitive result might be a new partnership between Furuno/MaxSea and Jeppesen, but I didn’t think we’d see results this quickly. Today Furuno announced that NavNet 3D displays will soon support a worldwide portfolio of “C-Map by Jeppesen” MapMedia charts, in addition to the NOAA raster and vector and “Datacore by Navionics” MapMedia charts they already support, thus making them “the most versatile” chart plotters available. It sounds great, but there are some details to note…
The C-Maps we’ll see on NavNet 3D displays — and in MaxSea TimeZero, I’m sure, though it wasn’t mentioned in the press release — will not be the new C-Map 4D cartography package introduced last Fall. That’s because Furuno and MaxSea made the decision a long time back to reprocess everyone’s charts into their own MapMedia .MM3 format. That was not necessarily a bad decision as apparently it’s what enables the extraordinarily fast and smooth TimeZero 2D and 3D chart presentations. But it does mean that all the extras in a vendor’s chart package and presentation engine — like 4D’s POI data, port photos, and automatic routing — are stripped out. TimeZero doesn’t have any of those features now, regardless of chart type (though I wouldn’t be surprised if they were in the works).
You may also recall that some users were pretty unhappy with NN3D NOAA charts when they first came out. I think those issues were exaggerated, and I know Furuno has made a lot of improvements since (in fact, new “Edition 3” NOAA rasters and vectors, and new fishing charts, were also announced today, and you can download them now). But, still, some competitors might justifiably argue with the “most versatile” plotter claim. On the other hand, the core chart data is unquestionably the most important part of any cartography package, C-Map is famous for the quality and coverage of its core data, and Furuno MaxSea is offering a lot of core data choices. Prices for C-Map by Jeppesen MapMedia charts have not been set yet, but the Furuno release says that they’ll start rolling out “early this spring,” starting with the East Coast and Bahamas. They’ll also be demoing them to folks like me in Miami next week.


Do you have a link to press release? I don’t see any “news” on the Furuno home page.
This is slightly off topic, but anyway: Regarding the “fast and smooth” TimeZero chart display, and some comments about antialiased charts display made here a few weeks ago, I thought I would start to make an overview of different charting packages and the image quality of their chart display.
By accident I came across this software: http://www.polarnavy.com/
It has the fastest AND highest quality chart rendering I have seen yet. For both raster and vector. It has GRIB overlay and costs USD33! Plus its Windows/Linux/OSX. Although it lacks a lot of bells and whistles I immediately loved it.
The site is VERY anonymous. Does anyone have a clue where they came from?!?
/j
Didnt Know that Maxsea had bought out Nobletec.
That explains why time zero has a “touch of the admiral” feel about it.
Steve.
Still Struggling along With CNP. Awaiting CE ugrade now any day I’m sure.
I’ve never heard of Polarnavy but I have a demo version of MaxSea Time Zero Navigator running on my laptop and it is THE MOST impressive navigation software program I have ever used. It is simple to operate and I’m looking forward to using the live version on the boat. I will be helping a friend install Time Zero Explorer to his boat which has NavNet 3D so it should be very impressive with radar overlay.
http://www.furunousa.com/products/productdetail.aspx?product=TZ+NAVIGATOR&category=Products+%3a+MaxSea+Marine+Software+%3a+MaxSea+Marine+Software
Steve, I doubt that CNP will be upgraded to CE 2009. As I understand it, Maptech Navigation and Coastal Explorer are no longer partners. I have even heard that CNP might be upgraded to an entirely new software package, like maybe The Cap’n.
It’s a shame really, because the original CE/CNP supported all the Maptech data nicely. In fact, CE 2009 still does, excepting the 3D stuff. Come to think of, The Cap’n does too, I believe. But the situation is confusing CNP users, as can be detected on the Maptech support forum:
http://bit.ly/aVI610
Hi Ben,
No, Ive gone to Brad directly and he’s letting me have the CE upgrade at same cost as US users.
Previously only available for US I believe.
What a nice bunch of people to deal with, Brad, Rick, Christine. Lovely outfit.
So looking forward to getting my package early next week I think according to FedEx tracking.
Birmingham Boat and Caravan/RV show end of this month here in UK. I’ll look out for anything new and let you know.
Steve.
In response to the first reply regarding PolarNavy products. I am a primary code monkey behind Polar Navy applications.
First, thank you for noticing the quality of chart rendering. Concentrating on essential functionality while staying lean and, hopefully, intuitive is one of the core principles in our applications.
There really isn’t much anonymous about us – WYSIWYG. If you or anyone else have a question – do not hesitate to contact us through all available means (email/forum/blog/phone – see http://www.polarnavy.com/feedback for complete details).
The Furuno C-Map release is up:
http://www.bymnews.com/news/newsDetails.php?id=65394
Thanks for coming by, (Polar) Nav. You have Jesper to thank, or curse, for introducing your software to this lion’s den 😉
Well, we aren’t big enough of an animal to get into the “lion’s den” any other way 🙂
In any case, it’s always nice when someone says a good word – and on Panbo in particular. So yes, thank you Jesper!
@John: Would you be willing to participate in a chart rendering quality overview? Maxsea does not provide a trial install and I don’t know anyone running this. I thought I could do it for the Panbo home waters, so if you have the time, get both vector and raster charts centered at about N44�15 E68�55 at 1:10000 scale and screendump with as large chart window as you can get. Send the dumps (in some non-destructive format, PNG or TIFF) to jesper XXX journeyman.se (replacing XXX with the @)
I will do Expedition, Fugawi and the new guy PolarView. Oh and Garmin Mapsource too.
If someone want to ship in a CoastalExplorer one too, feel free.
I will post it all in with a good layout for comparision.
(Ben forgive me for this slight thread hijack but I didn’t have this idea until a while after the last time the topic came up…)
Ben, a slight correction: Coastal Explorer 2009 does support the Contour 3D data that was included with the original Chart Navigator Pro (as well as the photo charts, topo maps, facilities database, and aerial photos).
Also, while Maptech does not currently have a replacement for CNP, Rose Point does offer a “competitive upgrade” from CNP to Coastal Explorer 2009.
Do you mean N44�15 W68�55 by any chance – Penobscot bay? It’s a tough general area to render with NOAA ENCs. Casco bay is even tougher IMHO.
I’m very interested to download these new “Edition 3” charts, and will do so this evening. The MaxSea TZ vector coverage has some serious issues, even where ENCs are available — take a look at Richardson Bay in San Francisco, or the coastline at the CA/OR border.
Will report in when I’ve got the new charts loaded.
Unfortunately, MaxSea TZ still only offers extremely low resolution satellite photos for regions like Australia/New Zealand. They also have no plans to increase the quality to something that might actually be usable (according to a couple of their reps via email). Hopefully if enough non-US customers vent their frustration, they’ll start to take notice.
The bathy charts are also very low resolution here (not worth using), and raster charts are non-existent.
Here’s a an example of the Australian MaxSea satellite imagery, with a comparison of the same area to Google Maps data. The satellite imagery included for the US-region in Maxsea is of very good quality, similar to Google Maps at most zoom levels.
MaxSea TZ: http://i.imgur.com/AeYUE.jpg
Google Maps: http://i.imgur.com/82LkE.jpg
The example was taken at a zoom level that would still be very usable in the US mapping areas.
With all this talk of adding extra C-MAP functionality to MM3D charts, it would be nice to see these regional deficiencies addressed as well. I’m still very happy with MaxSea TZ, just disappointed that I can’t take full advantage of the software.
Adam, re the Richardson Bay (San Francisco) coverage, the Furuno NN3D vector charts had a problem with this area in their second release, but this was corrected mid-2009. Is it possible that the MaxSea charts didn’t get the same update?
Paul:
Seems plausible. Here’s a screen shot of the Richardson Bay area on the charts I have (I haven’t downloaded the new ones yet):
http://screencast.com/t/MTc4ZTdhOG
And this is what I was referring to about the CA-OR border:
http://screencast.com/t/MjIxNTk2NjI
This is actually a satellite photo issue. The white box doesn’t appear if you hide the sat photo overlay.
I’m going to download the new charts now and will upload more screen shots after I load them.
Yep — Richardson Bay is fixed with the chart update. Excellent.
Hi All,
Well I would certainly be using the contour/3D/Photo features of KPM Charts if they had any as Brad suggests.
My last set of UK/EIRE charts from Maptech bought in November 2009 came badged KPM marine, and seemed to be a much stripped down version of what I used to buy…no boatlaunch facilities of any sort etc. Had to do a few fixes supplied courteously, but rather embarrassinlgy I think, by Evo Distribution (Memory Map)Maptech’s distributors for UK and most of Europe, to get the tides and currents to work even including a new TIDES.DLL for CNP.
I have now jumped ship to CE. I know that the tides and currents dont work, but I have successfully copied over the Guide Book and Gazeteer for Europe to CE no prob.
I can flip out to a program called Tide Plotter
from Belfield Software http://www.belfieldsoftware.co.uk
which is popular in UK and elswhere and is a snip at �10 per year. Does US East coast and Aus versions as well.
As I have already paid for my tide data I would like to try and convert it to a format that CE can read..or hope that RP will take pity on me and put a hook in to pick up the Maptech DLL and data.
But the most important thing to me is getting ongoing support and upgrades which ‘aint coming from KPM…tried their website lately??
Thats the main reason I jumped ship.
Steve.
[email protected]
I downloaded the latest Alaska SE raster charts for NN3D (version 3) and the data shown in the region of Smith Cove on 17426 is not as up to date as the latest NOAA posted chart for this region (issued in 2006). There has been a complete re-survey done in this area that is shown in the 2006 raster chart. I had reported a rock here in 1998.
Ben,
We installed the Furuno 3DNavNat system this winter as a main system. The previous Nobeltec system is still in place and can run parallel to the Furuno. Candidly, I have been disappointed by the Furuno chart programing under the 2.05. Way short of the Nobeltec system. I hope that they can fully integrate the Nobeltec program into the Furuno chart plotter (since they own the company). Their Vector charts fall way short of the same on Nobeltec and the ease of operation is the same.
Ben your knowledge is far superior then mine and I would appreciate your thoughts on if and when this might occur. What would stop it, other than egos?
Steve
Hey all,
just to let you guys know the cmap 3d data appears to be of higher quality than the other data they have been using.
installed the new c-map 3d data today and it transformed some areas.
the 3d data is free to install regardless of if you purchase the c-map chart areas.
Andy
We recently purchased the Navnet 3D 8 MFD and Radar.
The charts are not CMap charts. They are no where near the quality of the CMap Max charts. I believe Furuno is deceptive in its advertising stating that they are using CMap charts. It is not until you drill down into their website that you discover this.
Even then it is not clear that you are getting an inferior product and cannot use any other data source. The implication is that Navnet 3 D can use all chart formats.
“Note: All NavNet 3D chart data must originate from MapMedia in the “MM3D” format. C-Map and Navionics chips that are not in the “MM3D” format that are currently used in NavNet vx2 and other chart plotters will not work on NavNet 3D.”
Very disappointing.
Used OPEN CPN public domain previously and will continue to.
Kris, I’m really curious about where you’re seeing reduced quality in the C-Map data processed by MapMedia versus the same data presented in C-Map’s own Max format? Do you mean core data like soundings, nav aids, coast lines, etc. or the extras like port photos, POIs, etc.? Also, do you mean “public domain” C-Map charts?
Ben-
Could Kris’s problem be that he bought an older unit from a distributors stock that wasn’t updated?
Or maybe he hasn’t paid for the unlock code for the area he wants or doesn’t have the vectors set for Jeppeson. The boat I fish on recently updated to the C-map/Jeppeson for the east coast and bahamas on his dual MFD12s and it is every bit as good as my old Navnet vx2 with a chip. Actually I think it’s better.
Kris,
The converted data from all sources is cross-compared at many levels to appear exactly as, or better than, the original.
That said, we know of one or two areas in the Mediterranean where a small problem has been found.
Please report the lat/long of the problem to Furuno or mapmedia directly and we will check it out for you.
Note that if you updated your MFD from an older version of software, you must re-click the “Default” settings tab in the vector chart configuration pages. Not a big deal to do but, it does make a huge difference in how the new Jepessen Charts appear on any MFD.
Thank you for your intrest and support.
Yes I do mean core data like soundings, nav aids, coast lines, etc.
I am still in the installing testing period so don’t have the 3D data or Satellite data loaded yet.
The unit was purchased new in US in late July. We have only just installed it.
After exhaustive cross checking I think I have a Navionics “derived” chart in the Plotter. It is;
FURUNO MM3 CHART FOR Furuno Navnet 3D. $339.00. Chart Number = MM3 V68 POO Purchased 27th July. Downloaded and “unlocked” 3 days ago.
Examples of lack of data at,
005 59.068N 116 04.232E Sutera Harbour Borneo.
002 49.285N 104 09.454 Tioman Isl. Malaysia.
There is a problem with the contrast. The soundings are all very pale and almost unreadable. The image doesn’t seem sharp.
I cant log into Furuno to ask or send inquiry I get this error message “The username or password you entered is incorrect or your account has been disabled.”
I went to the Furuno website site and found the info to get the software version.
“To identify software version in your NavNet display, follow the procedure below:
1) Press [MENU] button
2) Press “SYSTEM CONFIGURATION” softkey
3) Press “SYSTEM SETUP” softkey
4) Press “TEST & CLEAR” softkey
5) Press “MEMORY I/O TEST” softkey
6) Press “DISPLAY UNIT TEST” softkey
7) Read Program number line. You will see a 10-digit number, the last 3-digits of this number will indicate the software version. For example, a program number of 1950001010 would indicate software version 10. ”
When I go to the “MENU” on my unit I do not have “System Configuration” but I do have “System”
after that though there is nothing similar to the instructions.??
I have noticed that some of the other instructions regarding menu’s are not the same as described in the operators manual.
Further to my last post. I have accessed the Version No through the menu via “MY NAVNET”. The version is 2.02.
Kirs,
On the Furuno USA website download software 2.05.
Any chance of some photos of this ‘not clear’ charts ?
Thankyou to anonymous
From: Anonymous
Kirs,
On the Furuno USA website download software 2.05.
Any chance of some photos of this ‘not clear’ charts
I will try to get that upgrade. With regard to photo comparison, I hav, but don’t see how to upload to here?
You need software version 2.05 to use C-Map.
Kris, you could post photos on Flickr or Picassa and give us a link, if you want. But I think it’s already clear that you jumped to some wrong conclusions. Apparently you are looking at Navionics core data as formatted by MapMedia. Only a comparison with a standard Navionics chart for that area — on, say, a Simrad or Raymarine plotter — would show whether MapMedia and/or Furuno are displaying the available data badly.
To fairly compare your MFD charts to C-Map Max, you need to buy the C-Map core data MapMedia region. You do have the only MFD (except for the Geonav series just coming out) that will let you use either Navionics or C-Map core data, and you’re in a part of the world where that can make a really big difference, I think.
I’m still curious about how you’re viewing C-Map Max now. There is no such thing as public domain C-Map charts.
You could say I jumped to some wrong conclusions regarding the charts and their use in the Furuno Navnet 3D, however as a “newbie” to chart plotters, and even after exhaustive research and inquiry, especially on Panbo, we have purchased a Chart plotter which we believed, from the information presented, could display several proprietary Chart formats.
It could be said that it does display the data as described but its not a fine line between being able to purchase charts from CMap or Navionics and access their folio’s or being locked into a single MapMedia supplier. We can only use charts which have been reformatted by Mapmedia from CMap and Navionics originals at their digression. Therefore the available chart areas are limited.
We cannot purchase a chart which covers all of Japan which is our next sailing destination. The cost of purchasing the two charts which would cover only two thirds of Japan is roughly $800.
One of the major attractions of the Navnet 3D was its diversity in chart choices. We in fact find that we have even less choice than had we purchased an old Furuno.
I acknowledge that the Tioman Isl. charts you can view on the following link are not absolutely comparative, however my point is that whatever charting software I purchase, it should be usable for navigation.
The difference between the C Map chart and the Navnet 3D MapMedia Navionics “derived” chart are quite clear. You would have to agree that even if the Navioinics “True” chart is better it should be reflected in the Mapmedia folio.
Tioman Island will be our first destination using the new Navnet 3D Plotter.
http://www.dropbox.com/gallery/13009763/1/Furuno%20Navnet%203%20D?h=3addd4
I will upgrade the Navnet software as soon as possible and see if the contrast issue is resolved.
Open CPN is a public domain Charting Program for computer. C-Map is not Public Domain software.
Thank you Panbo for this forum and for the advice from other users.
Thanks, Chris. We’re still comparing Navionics data with C-Map data, so it’s hard to tell if MapMedia or the MFD could have done a better job of translating or presenting it. As for the second part, presentation, that does differ a lot with zoom level, and also with software level. 2.2 made some improvements, for sure.
I am trying to figure out via online chart catalogs which companies have the best core data for the area, and it’s quite frustrating. In fact, I’m writing an entry about it right now. Can you tell me what version of C-Map data you’re using in CPN?
PS Kris, it turns out that Tioman Island is apparently not covered in the MapMedia V68 region you bought, as you can see by drilling down here, I think (wish they would show outlines of actual chart scales included):
http://www.mapmedia.com/catalog/VE_RSSV.html?ref=http://www.mapmedia.com/catalog/rssfiles/V68MAP1.1.xml
That information kind of negates the entry I was writing. Can you do a comparison of somewhere that’s definitely covered, like maybe the Anambas Islands?
Hi Ben,
Panbo is an international website many cruisers outside US and Canada regularly refer to for comparative test results of electronic equipment. I think you need to examine the implications for users outside the states.
Perhaps Furuno and some of the other Chart Plotter companies you are comparing will provide charts for areas outside the US and Canada for you to use to make these comparisons.
When you have figured out what the best core data is for the area (Singapore to Alutians) maybe you can check out the Satellite photos for the area.
The Borneo Philippines Satellite Photos don’t provide any usable information. They “cloud” the screen and would have to be turned off to navigate. Most of Mapmedia charted areas only support very low resolution Sat Photo’s. These are described as “standard resolution”. Quite what the use of these overlays is, I am unsure. With the stripping out of the Port Photos from the original software, one would have assumed that at least the satellite data would have something to cover it.
I cannot find any download or site to see a sample of the satellite data available with the chart areas. Sure you can see that there is Satellite data to download. But what quality are you going to get? Certainly nothing like Google Earth for my areas.
Data Files: Just what is the data I am suposed to be seeing? Tide graph? There must be more than that in the very big download files.
While you are making comparisons of the various Plotters performance at a charting level perhaps you could take a look at the latest chart prices from MapMedia and do a comparative with other popular chart products, for potential purchasers, in the market for a chart plotter.
I have just discovered the Navnet 3D charts are $900 US each, for the two areas (Japan) where we will spend about 1 month, and they only cover two thirds of Japan. There is no chart for the other third for the Navnet 3D.
Navionics gold chart, from which I asume the data for my Mapmedia chart arises (as there is no Platinum chart available), CODE: 31XG, V01.22 Q1 2010, covers at least four times the area of the Mapmedia chart and retails for around $279
CMap chart MW15 is at least twice the size of mapmedias @ $399
Our Navionics “derived” chart was $439 from Mapmedia and remember quarter of the Navionics size and only same usable data as the Navionics Chart.
The rub is that we thought we were getting a greater selection of charts and coverage and were going to see satellite overlaying these. Gullible maybe, but all the pretty pictures on the websites and brochures would indicate this to be fact. With no dealer within 600NM and only your site for verification we made the purchase. It needs clarifying for the rest of the gullible public out there.
It has just become an expensive Radar!
Kris, choosing marine electronics is like navigating: don’t rely on any single source! I work hard here to cover the subject, but I certainly don’t want anyone making important buying decisions solely on my say-so.
For instance, I guess I presume that most everyone realizes that satellite photography coverage varies a great deal no matter what source you’re using. That’s less true than it used to be in Google Earth, but it’s certainly true with all the marine cartography products. Neither MapMedia nor Navionics nor C-Map nor Garmin have satellite photographs of consistent high resolution everywhere, and they seem especially weak in remote areas.
But, in fact, I put some time into an entry — yet unpublished — about your problem with MapMedia charts in that remote area you’ve been cruising. But then, as noted a couple of comments up, I realized that you may have taken screen shots of an area (Tioman Island) that wasn’t actually covered by the chart region you bought. I asked you to make comparisons in a different place, but you never answered!
One of the neat things about the growing number of inexpensive charting apps is that cruisers like you can use them to see which cartography company has the best charts for a given area, either before buying expensive plotter charts, or as an aid when the best charts aren’t on the plotter.