NN3D chart issues II, & some news
If you’ll take a moment to read Ben’s comments on Panbo, you’ll understand the problem. There is data on the NOAA charts that is not on the NN3D raster chart view. There is a problem with the conversion from the Maptech format to TimeZero format.
Geez Louise! I may not have expressed myself well, but that’s not what I wrote about Furuno NavNet 3D chart issues last week. And the post above is just one of many that I think are way wide of the mark. According to some on Hull Truth the NN3D raster and vector charts for the U.S. are both useless, it was actually Navionics vectors that was shown at the boat show demos, the MFDs show less chart data than the Black Box because of video chip differences, etc. It’s mostly baloney, but Furuno USA has been paying attention to early user dissatisfaction with the vector charts. In fact, I got a call today from Camas with the news that Furuno will be selling U.S. NN3D vector charts based on Navionics data by early 2009. But let’s break that down:
Of course the Navionics vector charts will have more complete data than the NOAA S57/ENC charts that Furuno, and the rest of us, get for free. Because Navionics has painstakingly traced all the U.S. raster charts and NOAA hasn’t finished that task yet. But will the Navionics data look as familiar and good on NN3D as it does on, say, Raymarine or Northstar MFDs? I have no idea; I haven’t seen any screen shots, let alone had some solid time with a unit and the charts. And you do need to see them in action. Raster charts, which are just dumb bit maps, look like they look no matter where they’re displayed—aside from some details like anti-aliasing and where they jump scales as they zoom—but vector charts are only databases and the same data can look quite different from one display system to another, from one zoom level to another, from one user setup to another. As mentioned the other day, it’s not clear to me what NN3D vector issues are lack of data—which Furuno can’t help, except by offering commercial data—and what are due to data presentation anomalies—which Furuno can fix, and surely will. I’m really interested in seeing the NN3D charts based on Navionics data, but I make no presumptions about how they will look.
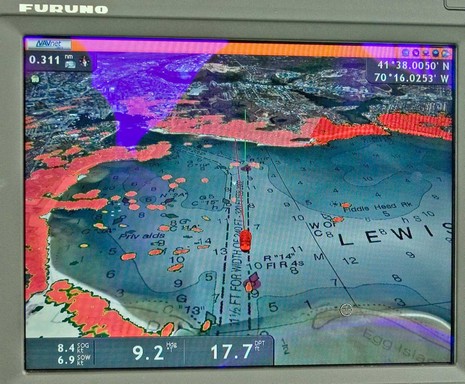
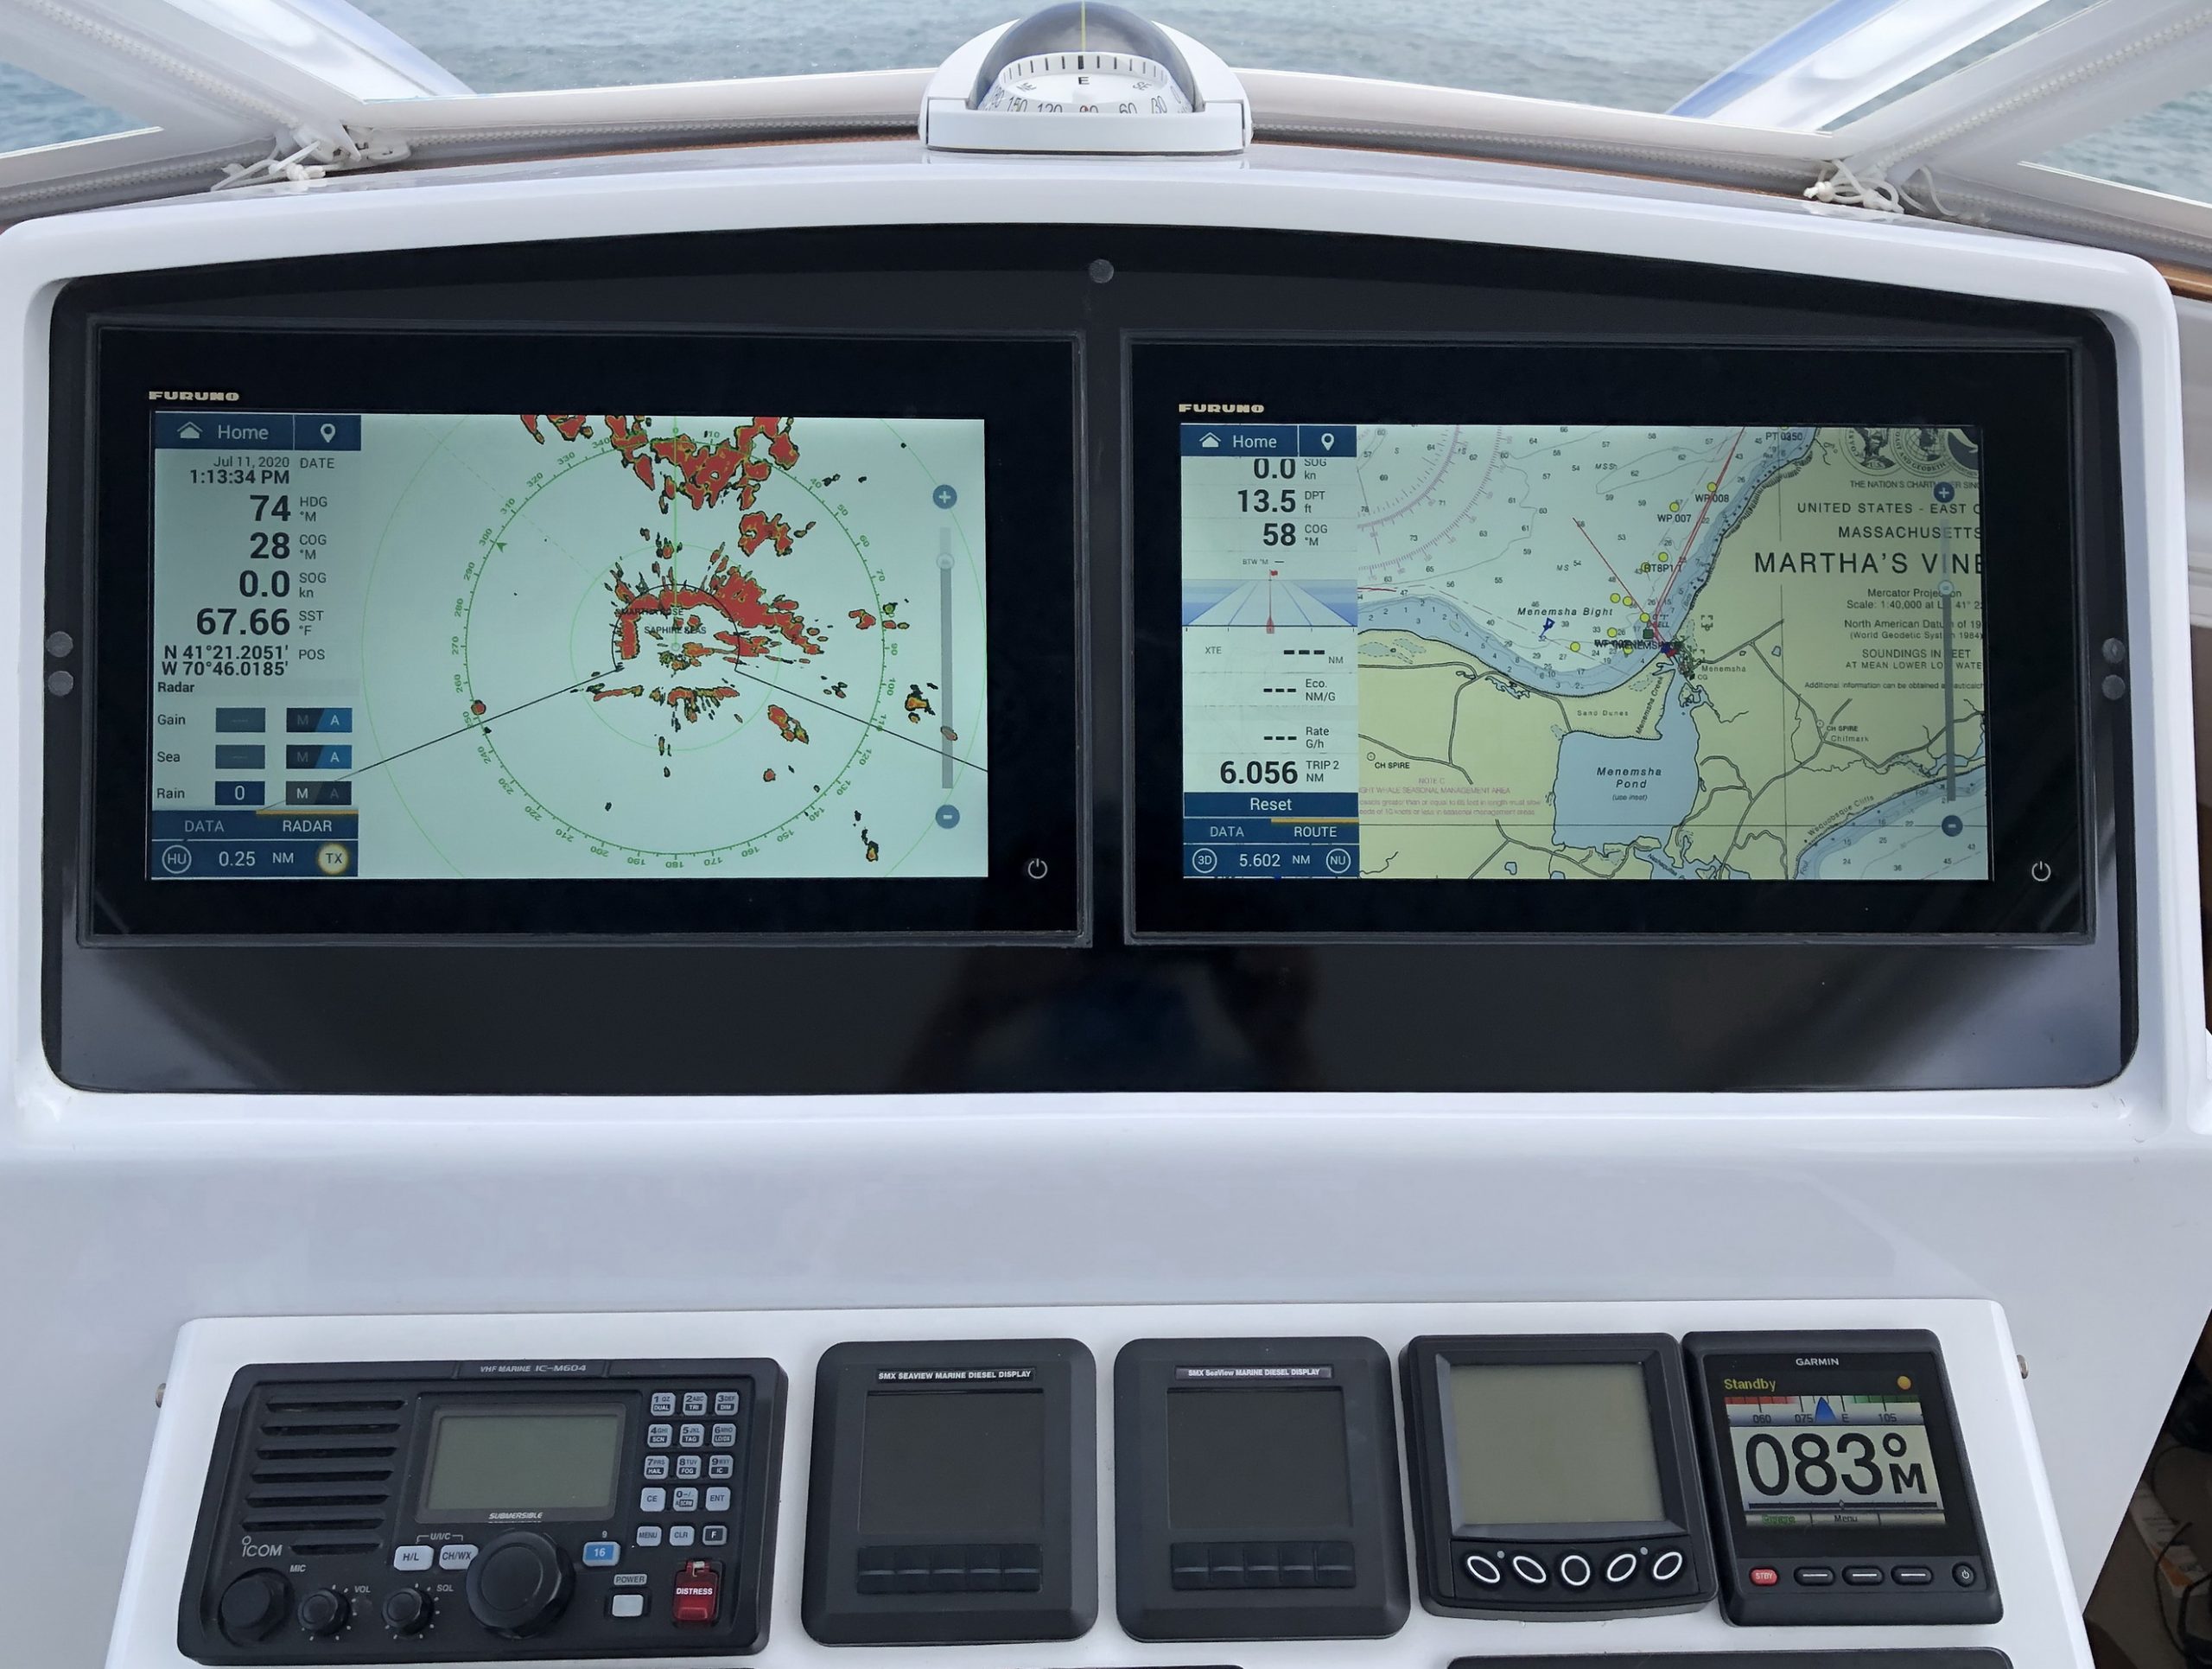
Meanwhile, what the heck is wrong with raster charts? Check out the bigger image
of NN3D above. That was real world boating, not a boatshow demo, and that screen worked even 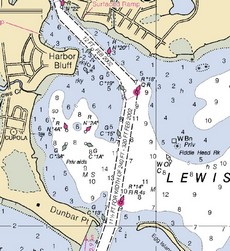 better in action than it looks in a photo, I thought. Now, as noted last week, an 8″ window on that same raster would be less informative, even though this particular chart, seen right and bigger here
, is in 1:20,000 harbor scale. Even better detail is available in complex places like Woods Hole and busy ones like Miami, but most coastal coverage is limited to 1:40,000, which can look oversize like last week’s example. Rasters weren’t designed for electronic display, but they are the official charts, there’s no better data for the U.S. and many other countries, and no software can misdisplay it (much). I’ll let Hull Truth poster “Ricknav,” who knows his stuff, finish this ode to raster:
I’ve been following this for a while and YOU GUYS ARE NUTS! Every Official NOAA Raster Chart is loaded into every display!!! I used to charge my customers over $2000 for these exact charts with their Northstar 972 Plotters as recently as two years ago when Maptech charged a lot of money for them!! Furuno openly told me and every other dealer that the NOAA Vector library was not complete. The latest information is that it will be done in about 18 months but the rasters are done and all there.
Additionally, I still haven’t seen a chart area where the Navionics or C-MAP Data is better than the original NOAA Raster Data that they copy to make their own vector charts. In fact I CHALLENGE ANYONE TO PROVE ME WRONG ON THIS ISSUE!! Show me depth information or land details that are better than the NOAA Raster Data on a Navionics or C-MAP Machine. Again, Navionics and C-MAP only copy this data. They have done no surveys of their own to improve it. If they have give the L/L and simply prove it to me.
I’ve installed all of the leading systems including Garmin 5000/4000 and Raymarine E/G Series and they all work. However, the idea that NavNet 3D is dangerous because it includes the official NOAA Raster and Vector Libraries that Super Tankers use to navigate our waters is simply Bullsh*t! — Ricknav




You seem to be concerned about defending raster charts. I like raster charts. But with limited screen area and pixels, like an MFD8, a vector chart holds the promise of a much better display of the information that I consider relevant at a point in time.
For example a raster chart may be cluttered with TD lines which I can omit in favor of clearer depth contours. I may choose different buoy details to be emphasized in a vector chart display, or different depth shading particular to my draft. That can’t be done with rasters.
Vector charts exist for a good reason. An accurate, high quality vector chart is much easier to read, and much faster to present for the display device.
High quality vector charts have existed for a long time, that’s why we expect to see them on state of the art systems.
What Furuno is confirming today is that customer’s expectations for charts are much higher than they thought, or than they can afford to give away. They’re responding with a higher quality offering, at a higher price.
Well it seems like like BetaMax VS VHS – circa 1975 doesn’t it? I have several hundred comments but I will limit it to just a few. First: There is NO MapTech format or NavNet format or TimeZero format or Navionics format. You people have all bitten in to the seeds that will sew things to come, as the battles for “Nav” ele’s, wages on. Data is data, period. NOAA, of all of them is THE WORST at processing their own charts in to raster OR vector charts. The problem is the KIDS with paper degrees from schools know nothing, compared to the Cartographers that actually MAKE them! Now, a little bit of education for the ignorant. “TimeZero” is only a massive forward thinking capable RAM system that allows extreme system load burstability, with great visual and functional happiness for the user. It is also know as “BIG BAD ASS COMPUTER” As far as all of your comments on vendors “formats”, thay all want to corner your use and have their stuff, not work on other’s machines. EXCEPT for cross compatible chart software and even they are picky! AND that will come to a very ugly halt soon, becuase the price will fall on all of the software solutions and charts, vector or raster, will be free to all. it will just require the computer (Nav gear) to run it. As a developer, I could really go on and on but I have just a few things to say: Have any of you ever heard of UNIX!!!! Do any of you even have CHARTS??? Dividers??? Parallel Rules??? Do any of you have a Sextant??? Do you even know how to use them??? Why are you even boating???? Safe Sail
Ben,
Thanks for quoting me from TheHullTruth. I don’t mind when these self-proclaimed “Experts” complain about delivery problems with Navnet 3D but, don’t twist your words in an attempt to put down the product.
It started when a Navnet 3D Customer of mine told me that he read TheHullTruth and that there was a problem with the NOAA Charts and why did I sell it to him. Of course, this is total crap but, my customer believed it.
I simply wanted to set the record straight for him.
Of course, other than saying that they added a dock at a marina here and there, no one has addressed my challenge. I won’t hold my breath waiting.
Russ, I’m sure that the paper chart, and hence the raster chart, will one day be history. But we’re not there yet. Heck, the vector chart manufacturers are still trying to make their presentations “look like a paper chart”, and no one has quite succeeded. It’s really hard to write an algorythm that can make decisions about presentation details like a human cartographer can.
But, that said, I agree that vector is going to be more useful on an 8″ display. However, why do you presume that Navionics’ raw data is “higher quality” than NOAA’s? I haven’t seen any evidence of that.
I think Furuno is offering Navionics in the U.S. mainly because it’s a complete data set, and NOAA’s isn’t.
@svJANDY,
I appreciate some of your comments, but the truth is that only on a slow sailing vessel, or hull speed power vessel are paper charts a great first choice now for navigation and piloting in unfamiliar areas. On a fast planing hull cruiser, the speed and convenience of electronic charting is a major safety advantage. The electronic system has to be backed up with paper charts and the 18th century plotting tools you cite, but modern, redundant electronic chart installations are a great navigation tool for fast cruisers.
“Why are you boating?”… please get off your high horse. Thanks,
Preston
NOAA charts ARE the source for Navionics USA coastal charts. However, Navionics makes 100’s of corrections annually to our products that use the Govt. source data (this is in addition to standardized NTM updates). We ask our customers to report real-world “discrepancies” found in the Govt. data…as we confirm errors in the official govt. data, we modify our product to reflect the marine reality.
Grabbing Govt. charts under the FOI act and re-selling them without modification or QA is a non-value added process. They’re free…why would anyone pay for them?
BUT
It’s no secret that, due to limited resources, many NOAA charts have not been updated for many years. The fact is, a lot (not all) of the paper data we utilize as boaters were published before the advent of WAAS or DGPS positioning accuracy verification. 15 years ago, a position discrepancy of 100 yards was not really relevant. Today, you can see if your position is off by 25′ under the right conditions.
What Navionics does is take the FREE NOAA database as the product baseline and adds (and corrects) data (wrecks, obstructions, georeferencing, shoals) to add value and accuracy to a product that isn’t free. As I have explained before to many GPS users reading here, our product is preferable to the NOAA/S57/paper data because we update it more often and update it knowing that it will be used in a device that can determine your position within a few feet.
With due respect to Ricknav…he is right about the source, but very wrong about the amount of corrections and enhancements that our customers drive and demand. The comment that he hasn’t seen any differences between the datasets is kind of moot…how many thousands of miles of coastline has he compared between the sources? Would he notice a 200′ repositioning of a single buoy out of 100’s of buoys on a chart?
Building an good navigation product requires far more effort than simply copying a source. After 25 years (the most in the marine cartography business) we have learned that there are no shortcuts to building a quality navigation product.
Raster charts seem simple, but they are not. The biggest technical challenge to them is making a “quilt” so that you have a seamless display; without knowing what the underlying data is there is no way to ensure that you are not hiding something important when you join two chart images. Nobeltec hid some kelp beds from me near Sucia island; no big deal other than surprise at finding kelp in what I thought was 300 feet. It would have been a big deal if the rock that the kelp had been on happened to be a bit taller.
There are also nontrivial technical problems with scanning and displaying raster charts. They are scanned in at a different resoultion than they are displayed at, which can lead to all sorts of distortion. Yes, you shouldn’t navigate so closely that it becomes a problem except that the wizzy display makes you think that you have more accuracy than you do. With a database, an appropriate algorithm will display stuff in the correct relative location.
Finally, I dispute the notion that raster charts are somehow more “official” than vector. The US vector charts are official; they are just not complete.
svJANDY, Data is data, but how that data is recorded, stored, and even presented is different. CMap, Navionics, and Garmin all start out with the same source but end up with different results. Try opening a text file created in Notepad in VI on Unix, the data will appear different because the systems handle CR and LF differently.
I don’t understand the actual process that each manufacturer uses to convert the originall NOAA raster data to vector, but that process is proprietary for each. If the charts were actually the same ‘format’ then we would be able to read Navionics charts on our NN3 units already (I have a Navionics chart on an SD chip for my NN2, I doubt my NN3 will read it).
I’m sure the NN3 units take advantage of faster hardware and more RAM to give it the performance it has, but that only makes sense – it exists and it’s cheap, why not use it? The real mystery to me is why hasn’t everyone done it?
I haven’t used a sextant since I was 20 and had to learn it for a sailing certification. I have one on the boat, but really only for decoration. I have paper charts (as required by law here), and I use them to plan where I’m going but I don’t have a big chart table on my bridge like some older boats do, so I don’t keep them layed out while I’m driving. Can I use them, sure, but I’m not out here to prove I can do things the hard way. I’m out to relax and enjoy myself. There’s enough stuff related to boating that has to be done the hard way (try doing any engine work on the outboard side of the motor!)
People are upset because they expected great things from NN3 and they expected perfection in the first release from Furuno. Such high expectations are hard to meet for anybody.
As to charts being free, I think you get what you pay for. Had these problematic charts been from Navionics, we’d likely see a faster resolution because that company specializes in charts and has the capacity and capability to respond more quickly than a smaller, less funded organization. That level of response is never going to come for free. I don’t work for free, will you?
I called Navionics about a problem with their charts in my area last year. I spoke with a tech rep who took down all the info and I checked the next update and the issue was resolved.
Ben – I think they are higher quality because if I compare the chart display of the same area (SF Bay) on my ancient 6″ Northstar 952 with a Navionics gold chip to my new MFD8, the Northstar data is easier to read.
I’m talking strictly of the chart data display. Of course the 952 doesn’t have 3D, radar overlay, AIS etc.
That’s exactly my point, Russ. I think that on the Northstar you’re looking at Navionics data as presented by software that’s the combined effort of Northstar and Navionics. The same raw data might look quite different on NN3D.
I think that Navionics data converted into Mapmedia 3D format is a different animal than any Navionics charts we’ve seen before. How it looks is largely up to Furuno/MaxSea. I’m not saying it will look bad, just not to make presumptions about it.
Now as for the quality of the data itself, Jeff Brodeur’s comment above may have blown a misconception I had. I’ve always thought that the commercial chart makers stuck with “official” data when it involved critical navigation, like buoy and obstruction positions. Even though some of the official data is old and inaccurate. But maybe I was wrong. I’ve queried Jeff for more information.
The charting debate of Furuno’s NN3D charts has really highlighted the big question that I’ve always had and that is “how accurate” are the vector charts supplied by after market companies (C-Map, Garmin, Navionics etc). This was in relation to another forum raving on about Garmin’s Auto Guidance feature? I do not think I would rely on inaccurate charts and a “PC” to auto guide me when I could use vector charts as a reference, the raster as “official” and my eyesight and navigation skills for safety. Just remember the peoduct warning you get every time you turn on your plotter or open the operators manual……it’s there for a reason!
Needless to say it is obvious that consumers want their charts not only to look sexy but also to be accurate. If the mm3d charts for Furuno are based on the officla paper charts and the Navionics data base then I would think that as for data they would have the best of both worlds. It would seem that Furuno (Mapmedia) needs time (more time) to get the conversions perfected. I also believe that NN3D will offer a great deal more customization for the look and feel of the charts.
Regarding this comment:
“That’s exactly my point, Russ. I think that on the Northstar you’re looking at Navionics data as presented by software that’s the combined effort of Northstar and Navionics. The same raw data might look quite different on NN3D.”.
It is a combined effort with Navionics providing the core library, but Northstar provides the speed and readability enhancements. There are problems with the data presented to a Chart Plotter, for instance in many places all the wrecks and rocks are told to appear (by the Navionics database) at a certain zoom level. It should be that WRO (Wrecks, Rocks, Obstructions) appear at the zoom level that the professional cartographer intended. All Chart Plotters using the Navionics library should obey the database.
Good lord, there are still posters on the Hull Truth who think Furuno somehow faked the boat show demos, like by using Navionics vector data. I don’t think that data even existed back then.
It would be useful if someone who actually has an NN3D unit took photos of the Miami charts. I’ll bet they look just like the demos. The official NOAA data, raster and vector, is quite detailed there, as it is for many busy U.S. ports.
Ben – I don’t think anyone on Hull Truth thinks Furuno faked the demos at the boat shows. I absolutely don’t think that’s the case.
However, what some (including me) think is that Furuno represented that NN3D systems (whether BB or MFD) would include full raster cartography (which they do) and full vector cartography similar in character to the vector charts they were showing with such enthusiasm at the shows.
It is true that their brochures reference “complete NOAA raster and vector chart libraries…” and perhaps, in the spirit of caveat emptor, those of us who have purchased the system should have investigated whether the level of detail shown on the charts they were using in their demo was available from NOAA for the entire US…instead of assuming that what Furuno was demonstrating was representative of what would be included in the “free cartography” provided with the system.
Because at the time I was in the process of deciding on whether to go with Garmin or Furuno, I had specific, explicit discussions with Furuno reps at both Ft. Lauderdale and Miami on the issue of “free” included cartography. I assure you that they gave no hint that much of what would be included was inferior to what was being demoed.
I happen to like and value raster charts. I also use and understand the benefits of vectors – and appreciate how they are evolving and the advantages they can offer. I’ll be able to navigate just fine with NN3D rasters until the vector issue is resolved.
But if Furuno asks me to spend thousands of dollars to have vectors comparable in quality to what they demoed at Ft. Lauderdale and Miami, I will not feel fairly treated.
Richard
Ben, I’ve taken some pictures of Maimi on my new Furuno MFD12. I am a dealer in Australia and have received one of the first sets which comes with US charts pre-loaded. I have set it up with dual plotter and showing Miami in Raster on the right and Vector on the left. What e-mail address can I use to send picture to you. Regards John
marineelectronics@hotmail.com
Thanks, Richard, but how can you deny that a few Hull Truth posters are talking about “bait and switch”, class action suits, and whether “The charts at the boat show are the same as the ones loaded into the units shipped”? The charges make it sound like Furuno was consciously deceptive, which is far different than salesmen who don’t know a new product well.
I believe that what was shown at the shows and is loaded on the units IS the complete official NOAA raster and vector library as it exists today. And I think it’s pretty well known that NOAA has not yet converted all rasters into vector. It’s certainly been discussed here over the years. In fact, it would be good for anyone dissing raster charts to check out some of the entries from a couple of summers ago, like this one:
http://tinyurl.com/6y3tte
Thank you too, Wildfish (I just e-mailed you).
Furuno has put up an excellent FAQ (PDF) on the chart issues:
http://www.furunousa.com/documents/nn3d-faq-2.pdf
NN3D – 40 GB HDD – Why? Implications?
I’ve been reading the various Furuno issued documents, including the ones addressing data installation and data management, as well as the operating manuals for the BB and the MFD12/MFD8.
Apparently the units are configured so they can address not more than 12 “Memory Blocks” (also called “Memory Slots” in some of the docs), each with a maximum capacity of 2 GB. The US raster charts use four blocks; the vector charts use one block; the US bathymetric data uses one block – for a total of six. Thus, there are only six Memory Blocks remaining available for other cartography (e.g., Bahamas) and for satellite imagery.
As a result, if you are traveling up the US East coast from Florida to Maine, and even if you’ve deleted all West coast and Alaska/Hawaii rasters (freeing up two Memory Blocks), the system cannot hold all the satellite imagery for your trip. Thus, as you move along the coast, you need to actually take the step to delete the imagery for the areas behind you and load, from 2 GB SD cards (no larger SD cards or a USB HDD allowed!) the additional imagery as you move along.
The documents state that the hard drives (HDD) in all these units (BB and MFDs) have a maximum capacity of only 40 GB (this in 2008 when high-quality, high-speed, high capacity HDDs are incredibly inexpensive; marinized a bit more no doubt by still, 40 GB?). So it is not possible to store the additional imagery files on the HDD and move them easily to available Memory Blocks. Each time, they must be individually deleted and then individually reloaded from 2 GB SD cards.
While the twelve Memory Block limitation doesn’t make much sense to me, perhaps there is some plausible reason why the system cannot manage more. But I am unable to grasp any plausible reason why Furuno wouldn’t provide more HDD capacity than 40 GB.
And, with 8 GB SD cards (including Sandisk, Furuno’s preferred brand) widely available for between $40 and $50, I also cannot understand why have they configured the system to accommodate nothing larger than 2 GB SD cards?
If anyone can shed light on these issues, I’d appreciate it.
Richard, I don’t know the exact reason for any of that, but if it’s part of why the units are so fast, I’m good with it!
Also I’ve heard (not officially) that Furuno is going to sell a $200 hard drive with all U.S. cartography and a $300 unit with the whole world cartography. You can cruise with one of those aboard and just do the SD card data swapping as needed; shouldn’t be a huge hassle. For foreign chart regions (or U.S. Navionics data), of course you’ll need to purchase unlock codes.
Ben – Well, I dont’ think there’s any way the small size of the storage devices doesn’t have any impact on system speed – which is fantastic – though the limit to twelve Memory Blocks of 2 GB max may.
Actually, they have officially announced that they’re selling an outboard USB HDD w/ the US cartography and satellite imagery – and that they’ll be introducing a larger drive offering somewhat later.
I read through all these comments again, and want to clarify something. While I still don’t think Navionics or any other commercial chart vendor adds much in the way of critical nav info to what’s provided by NOAA in raster and (incomplete) vector formats–though I may be persuaded otherwise by Jeff Brodeur or someone like him–I definitely think that Navionics and some of the other vendors add all sorts of addittional data that’s helpful to navigation and to just plain enjoying your boat and the places it can take you to.
Furuno is going its own way with charts for NN3D and while I conceptually admire the decision to support raster and S57 vector formats–the choice of the world’s hydrographic offices–they’re missing a lot of the extras like POI data, pilot books, and panoramic photos, not to mention an established chart distribution and update system.
The violent reaction to U.S. NN3D charts is way over done I feel—heck, PC navigators have been getting by fine with the same for years—but no doubt reflects how comfy some boaters were with commercial chart packages. Over and out.
Offering huge HDD space for chart storage should be the last of Furuno’s concerns. Is this not simply a case of 99% of the users will never require charts for the whole world net alone the whole of the US? Only a VERY tiny percentile will ever take their boats much further than their coastal cruising regions, say a few hunderd miles?
Furuno europe should have a much cleaer idea of the vector charts and advanced features time frame within 2 – 3 weeks will keep everyone updated.