
“Monkey Business” — blast from the past #1
Did you ever see the first-in-20-years Bob Dylan interview with Ed Bradley where Dylan expresses astonishment at lyrics he himself once wrote (like It’s Alright, Ma), and said he couldn’t do it again? A memorable TV moment with a weird and reluctant diety, I thought. My work is absolutely not comparable to Dylan’s, but I do sometimes run across a piece written long ago that surprises me in a good way. That happened today with a 2004 PMY column called “Monkey Business” whose catchy subtitle was “Charts separate men from apes, but the path from paper to digital passes through the jungle.” I thought I’d republish it with the images that are no longer online, plus links, corrections, and more images. Hope you enjoy…
I recently heard Dr. Juan Enriquez, a leading authority on life science, explain that human DNA has a 98.8-percent overlap with simians. The genetic building blocks that produced me (and you, no offense meant) vary from a monkey’s by only 1.2 percent! Yes, I’ve been listening to big thinkers again, and once more charts came to my mind (see “Stupid Chart Tricks,” January 2004). You see Enriquez went on to explain that the relatively small but key difference between humans and chimps is not tools or talk but the ability to communicate information across time, the capacity to create alphabets, books, constitutions, computer code, and–shaking my vine most especially–maps.
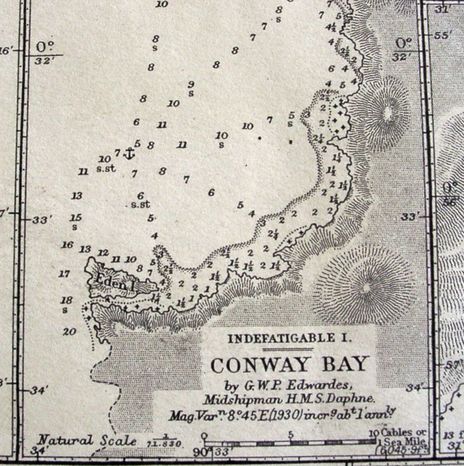
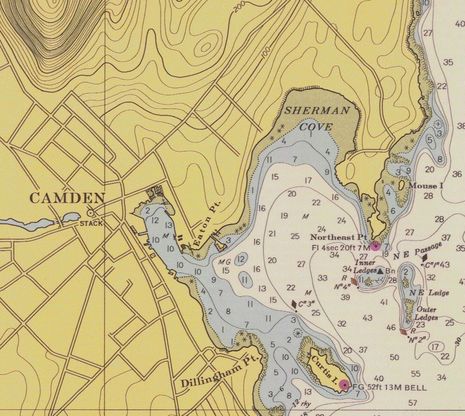
For years I’ve lived in awe of the nautical chart, which I first experienced as a large piece of paper brimming with valuable information expressed with a carefully developed graphic alphabet. On a single sheet you can see the work of explorers, surveyors, and cartographers working together over generations to locate, catalog, and diagram all the above — and underwater features you need to safely navigate that square of ocean. When you become adept at reading a chart, you can vividly picture what the area looks like, and better yet, it’s also designed to be the workspace you use to actually get there. I love charts and concur with Enriquez that they are one of the most evolved of human accomplishments. {Note on this circa 1930 Galapagos chart below how you can literally see the courses the surveyors probably rowed from their anchored ship.}
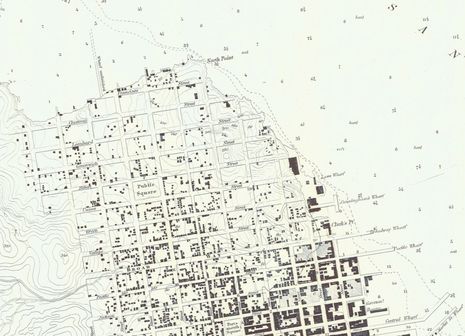
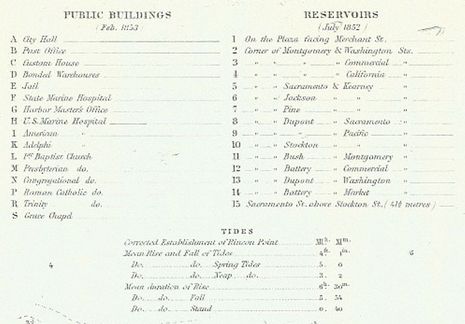
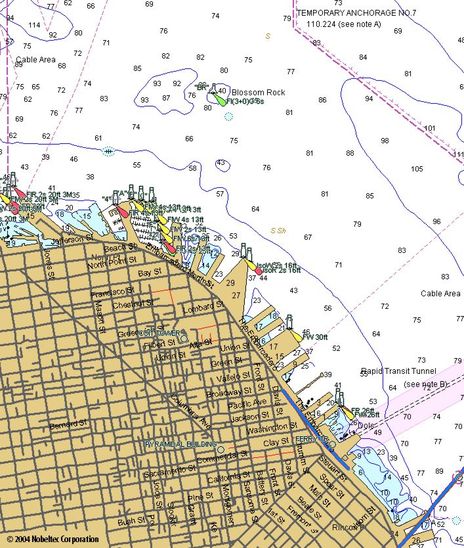
Moreover, charts can be beautiful, particularly the old-fashioned ones that were etched by hand. Look at the level and artfulness of detail on the bit of 1853 San Francisco harbor chart on page 46 (at top). You could have used it to find a decent place to anchor or sail up to a particular dock, then to get around town. Up in the corner (outside the illustration) there’s even a key, in a fine script, to important locations like the harbormaster, post office, and jail. Maybe I have an overactive imagination, but I can practically smell the tarred manila and hear my gold-crazed passengers clambering down the gangway. Today this piece of paper is also dramatic graphic evidence of the city’s incredible growth, a process in which charts played an important part, which is why, in addition to world exploration and empire building, Enriquez characterizes map-making as a cornerstone of civilization.
But now we’re going digital. All the world’s alphabets, graphical and musical included, are collapsing into sublimely simple but powerful 0s and 1s. Ironically, and delightfully, the high-resolution San Francisco image and thousands of other antique chart scans are available for your perusal and downloading in the historical section of NOAA’s Web site, www.chartmaker.ncd.noaa.gov http://historicalcharts.noaa.gov. You can even print them onto paper, though the unusual file format NOAA uses makes that quite a chore {no longer true, glad to report}.
The topic of formats brings me to some less-pleasant aspects of our paper-to-digital transition. According to a marine-industry committee working on the issue, electronic charts are currently in at least 15 different data formats delivered via at least 13 different media formats. I can recollect days in Hispaniola using scrounged charts printed in Spanish, and I got by; maybe I had to puzzle over some of the notes with a bilingual dictionary, but the medium, paper, is universal, and so are most of the graphics. Today, if you try to stick anything in your plotter except the right type of memory cartridge with the right type of charts on it, you’ll get nada. This is not an advancement of our noble ability to share information.
Maybe one format of electronic charts will serve all your needs? It is true that the major vendors have huge portfolios, but as best as I can determine, no one has everything. And in some parts of the world, one hydrographic office–which is where vendors get most of their data–did better work than another. Plus many of the chart companies are beginning to license privately made cartography, even doing their own surveying, a nifty trend that I’ll cover next month in part two of this column.
Let’s just assume that you’d like as much flexibility with your electronic charts as possible. One route is to use a PC charting program that supports multiple formats. But wait, Maptech, vendor of the best-selling paper-like ChartKit raster charts, just changed its data format to BSB4, and Nobeltec, developer of probably the most popular PC navigation program, VNS, has no immediate plans to support it. Huh? I can’t count the boats I’ve been on that use VNS with ChartKits; there are a lot, but from now on the combination won’t work (note that present and future versions of VNS will still run BSB3 and prior).
The major change in BSB4 is that the charts are encrypted, a move that’s unfortunately long overdue. For years boaters and even dealers have been swiping Maptech chart CDs like kids downloading tunes. Encryption is another hassle of the digital world, involving phone calls or Web visits and long numbers to be squirreled away for a day you hope won’t come, but Maptech claims that its particular technology is thoroughly tested and easy to use. Plus, as a bonus, owners of the format will receive any new chart editions that are issued during the first year. Meanwhile, for the time being, Nobeltec is keeping its software engineers working on current (and interesting) projects rather than modifying VNS for BSB4. The decision is based on the company’s confidence in its own Passport vector charts, which are great (and encrypted, by the way), and the availability of its own raster charts, not so great but to be improved eventually.
So if you are a VNS/ChartKit user and want to get new charts, each of the companies will try for all your business (Maptech, after all, has its own improved Offshore Navigator program). Some folks are going to frown on this whole development, but in my view the real monkey business is going on elsewhere, north of the border.
In Canada a small, private company called NDI (Nautical Data International) has the exclusive right to sell or license electronic versions of CHS (Canadian Hydrographic Service) charts. NDI has a history of irritating customers with an early flawed encryption scheme. Now the company is apparently attempting to charge unusually high royalties to the other vendors of Canadian charts. Sparks are flying. Stories vary, but I can confirm that some of the companies that have current agreements are unhappy, and the two that don’t–C-Map and Navionics–are very unhappy. Both, in fact, have temporarily stopped shipping Canadian charts (see www.navionics.com for more information). Negotiations are underway and hopefully will successfully be concluded without ghastly price increases. But it’s a disturbing trend, especially as an NDI vice president told me that his company is simply pioneering the way as hydrographic offices–and their for-profit sidekicks, I guess–around the world begin to practice “cost recovery.”
The situation on this side of the border is strikingly different, and I look forward to detailing NOAA’s efforts to vectorize all U.S. charts and give them away. For now I will conclude with some of the big thinking that inspired the column and also puts its worries in perspective. I believe that Enriquez would tell us that the sort of cartography that I’ve been talking about here is essentially completed; the maps that really sizzle today–the maps that are shaping the future, the maps that might build empires–are being drawn to nano scale by explorers of the human genome. We boat people have already charted the oceans pretty darn thoroughly. Now we’re just dotting the “i’s” and getting our digital act together. I like to picture a future when these monkey business issues are resolved and perhaps our plotters/computers will even be nimble enough to pull up an antique chart if desired. Just for old times’ sake.
Please note that the above was written in 2004. NDI is gone without a tear, MapTech is gone with a few tears, depending. Electronic charts are way better than they were and much less expensive, though NOAA’s free versions are oddly not the most trustworthy U.S. vectors in my experience. I still love old charts and still stand amazed at many old Dylan songs (and even some new ones too, Bob, like Things Have Changed).


It’s wonderful how much NOAA’s historical chart site has improved ( http://historicalcharts.noaa.gov/ ). I easily downloaded a stack of high resolution local charts, now in easy-to-handle .jpg format. My hope that PC charting programs, or even plotters, would one day be so powerful that they could show you the old view hasn’t happened yet, but you can do it yourself.
Ben,
The Portolan charts you show would have been state and mercantile secrets for most of human history. The impetus not to share these is in the DNA you mentioned.
The mercantile and physical survival importance of knowledge of ports for trading and offensive/defensive purposes is deeply biological and only slightly culturally nuanced. The Spanish, Portuguese, Genoan, Venetian, Dutch, British, and French policies were virtually identical — For most of human history, being caught with charts, sailing directions, sailing cards of an adversary was a death sentence. Equally, they were among the first things sought out after a ship was captured.
The charting and geodesy people who did the best job of protecting (and obscurating) this information were the institutional survivors in the their relatively tiny community.
Today’s M, C & G technological protectionism and obscurantism is a cultural inheritor to this tradition. In this business a level playing field only serves the consumer…
Competition for the marginal consumer dollar favors vendor lock-in over open standards. With open standards one has to differentiate on price and quality. With vendor lock-in one just has to make it too fiscally painful to change.
What this business needs is a killer app in the Downes and Mui sense of the word.
And if I sound a tad irritated it’s because of what I just had to pay to update my high-end digital products that still manage to take me through bridge abutments, docks and across dry land in several spots. Products I am locked into by my choice of radar and chart plotter six years ago when this chart provider was the leader.
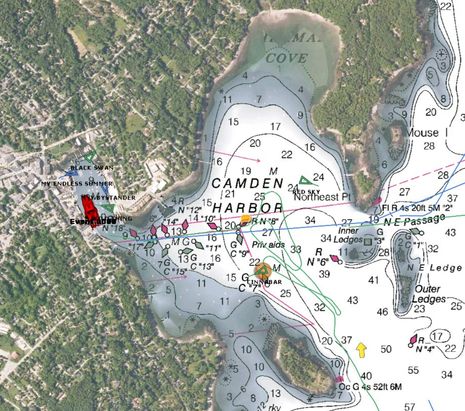
Good historical data, thanks. Now we await the REAL next gen… Google Earth moving maps with full visual terrestrial viewing and pinpoint water accuracy. I have copied them and with a bit of copy and pasting and overlay work was able to have a second to real time plotting over a Google Earth map. Can’t wait the for the future…but I guess I will have to!