
PolarView, ready for prime time?
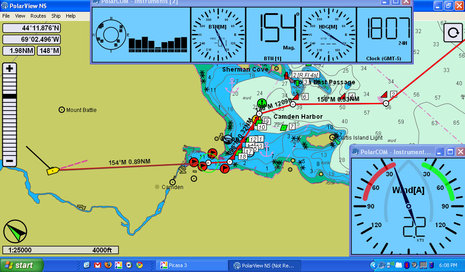
I took a peek at PolarView NS charting software about a year ago, but didn’t write about it because I wasn’t especially impressed (and there’s a certain randomness to what I cover anyway). But times change and software develops, and I’m here to tell you that PolarView 1.5 (video introduction here) is pretty darn impressive. Given its app-like $40 price tag, it’s a remarkably powerful program that runs on Windows, Mac OS X, and Linux operating systems. The screen above shows PV running on my little ASUS Eee PC 1000HE 10-Inch netbook
with live NMEA 0183 data coming from the lab’s N2K network via a Maretron USB 100. PolarView is quite unusual in that it uses a sister program, called PolarCOM, to do all its data interfacing and instrument displays…
Having those instrument windows as a separate program is a little awkward, I think, but then again you get lots of control as to how you size and configure them. Plus PolarCOM — which can be used on its own, and is entirely free — automatically found the NMEA 0183 feed, and apparently can even multiplex it, and also seems to have well designed alarming functions. In fact, it took maybe 15 minutes for me to get PV fully running on the netbook, largely because it also has a fast, easy facility for downloading ENC vector charts for a desired geographic area.
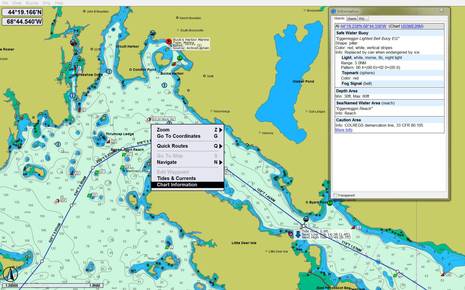
I’ve corresponded a little with PolarView’s developer, who I know only as Gene, and know that he favors vector charts over raster. And PV does quite a nice job of displaying them, as you can see in the screen below, taken on my high res desktop machine. I particularly like how you can open that Information box and leave it open as you click on ENC objects like that EG bouy. I’m not sure I’ve ever seen ENC info so clearly presented. Note too how this display has been set up without Windows menus or PV’s own on-screen Zoom and Tool menus (there are numerous keyboard shortcuts). And check out the ActiveCaptain icons including a clicked Buck’s Harbor Marine label toward the top of the screen; yes, indeed, a major feature of PolarView 1.5 is AC caching, display, and review editing, as trumpeted in yesterday’s AC newsletter. (Panbo readers are also invited to try a 30-day free preview of the PV 1.5 before it goes public next week; just go to this page and use the invite code “PreviewPanbo”.)
Something else of interest regarding this screen is that I went to this area because it used to glaringly demonstrate the fact that not all U.S. charts have yet been converted to the ENC format. But, low and behold, NOAA has recently created the ENC equivalent of paper/raster #13309, and in fact a quick check suggests that there aren’t any significant holes in ENC coverage of Maine anymore. Progress! But note that PolarView also does a good job of quilting and displaying raster charts, and look what I found when testing them…
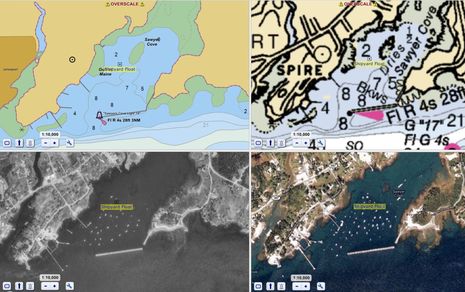
Yes, friends, even though NOAA said that the infamous Jonesport breakwater probably wouldn’t get charted for “a couple of years,” paper/RNC chart #13326 was updated with the breakwater in early January, as was the equivalent ENC (US5ME52M). Note how nicely PolarView shows cached ActiveCaptain detail in that same Information box, and note too that bit of satellite photo imagery. We’ve seen something like that done before, and found it a sensitive subject, so I’ll just note that PV’s image management/download facility is quite interesting, and definitely another reason some of you may want to try the 1.5 preview (and hopefully report back here on your findings)…

Not that PolarView is real competition for the big charting software packages from the likes of Nobeltec, Rose Point, or MaxSea. It can’t, for instance, split a display into multiple chart windows, which is why I’m using Coastal Explorer 2011 to offer further suggestions about Sawyer Cove charting (and maybe gloat a bit). While you can see from the satellite photos that the new raster chart seems to have the breakwater just right, the new ENC missed the eastern opening that some local boats use. And neither chart has yet caught up with the dredging that allowed Gizmo, with 4-feet plus of draft, to sit comfortably on that Jonesport Shipyard mooring float for several days last summer (while I yakked about cruising guides). But progress has been made, and it just may be that this obstreperous scribbler helped it along 😉


I’ve been using this software for a while and certainly a fair amount as the ActiveCaptain integration has taken place. I love the Mac support – all of these features including AIS, tides and currents, weather GRIB overlays – all work native on the Mac for a very low price. So while I use other software for navigation on my PC’s, it’s incredibly nice to have an app to open up on the Mac or for backup.
Needless to say, having ActiveCaptain offline makes for a very nice planning tool too – PC, Mac, or Linux. The licensing allows use on 5 computers at the same time. It’s just all really nice.
Apart from Ben’s success with it, if you have a Mac, you really must install PolarView. I’m really interested in trying this on an inexpensive Linux slate too and would love to know other’s experiences with it there.
Ben,
The software is indeed nice, with some real thought put into it.
Any idea why “Gene” is so reticent, and even slightly crochety (see early MacSailing thread on PV), about being asked who he is, background, experience, interests, maybe even a whole name?
I do now, Lobbo, and wish I hadn’t mentioned it. Gene has a unique last name, works a day job in the data security field — which might make anyone a dite paranoid — and would like to keep his two work lives separate anyway. I don’t sense that he’s really reticent, but he is just Gene, and I think we should let that be. Thanks.
First impression: seven-segment numbers? why? Those are ugly and unreadable.
I find that PolarCOM instruments usually evoke either “love it, it’s stunning” or “hate it, it’s ugly” views, when it comes to visual design 🙂
Personally, I like the “real instrument” look and was going for it on purpose. It is simple, versatile and gives itself easily to reconfiguration.
What would you prefer to see in a design of virtual data instrument?
Let me make sure I’m following this. “lobbo” is concerned that Gene wants some privacy so he raises his concern by making an anonymous comment?
Gene, I have to agree with Norse about the faux segmented LCD instrument displays. The real ones aren’t all that readable anyway, and they usually have a much bolder stroke weight. After all, the font is designed around strict technical limitations. Check out current instrument displays like the Furuno RD33 and Garmin GMI 10 to see where data display is headed now that it’s rendered in high resolution color pixels (which PolarCOM can of course emulate).
But hat’s off for all the menu, dialog box, and vector chart fonts in PolarView. I found them notably legible on both 10″ and 21″ screens.
Modern instruments are pretty much LCD displays that use standard fonts. I guess I’d agree that they are more readable. It also makes development a lot easier.
It’s just that I am partial to the slightly “retro” look of previous generation Raymarine or B&G instruments. My own preference is the red-on-black palette, like the one here:
http://polarnavy.wordpress.com/2010/03/24/windows-ui/
That said, it may be worth while to add more traditional text/font display as an option to instruments. I’ll put that on the TODO list for PolarCOM.
Ben, what is the source of the Google Earth (color) sat photo in your quad-split-screen CE screenshot above?
Thanks!
Adam, explained here:
https://panbo.com/archives/2010/10/jonesport_breakwater_aid_with_chartaid.html
I have had both PCom and PView for a little over one year now. I had trouble getting it to run the first time, but after that it has been bullet proof. And I am pretty sure the install problem was my fault.
The instrument package is mostly unused so far. But reading this article has prompted me to think about hooking up the depth information and maybe, just maybe being able to use it to sort out my Garmin depth problem. Hmmm…
I am considering doing something about instrument digit visibility for this release.
Leaving aside an “aesthetic” issue of design, which I probably don’t have enough time to change anyway, I’d like to try a few adjustments.
Would you consider something like this to be more readable than the original?
http://i55.tinypic.com/e0qcp.jpg
I wasn’t going to mention the 7-segment display (since it’s somewhat a matter of taste), but now that the subject has come up:
I don’t like them, and find then unnecessarily difficult to read. The retro look is kind of cool, but I think this is an example of function losing out to form.
Similarly, the “Plaincode Magnetmeter” shown in a previous Panbo column (https://panbo.com/archives/2011/02/ipad_cases_for_the_boat_some_interesting_apps.html#more) is a visually interesting display that probably took a lot of work to get just right. Unfortunately, to my eye there’s just too much going on that has nothing to do with any information I might need. Since I don’t know exactly what this app is trying to display perhaps I’m missing something essential, but I believe that a good display should make the important stuff pretty obvious.
End of rant.
Yes, increasing the segment width helps. Look how fat the segments are on Furuno’s FI-50 instruments:
http://goo.gl/VSUGY
Hats off to Gene for the separation between the lower level functions in PCom and the higher level display in PView. Combining the two is where most other programs (including the big guns) run into trouble. My guess is that the delineation between them is at the socket level, which is precisely where it should be.
I looked at newer B&G and they are similarly wide, and also use a slightly differently shaped segments.
I am also going to add a plain “black on white” color scheme as an option.
Hopefully, between these things – visibility will be less of an issue.
It does solve many issues from instrument latency to protocol processing, also helps build de-coupled systems.
My favorite, though, is that it allows building dedicated instrument systems, which is where the design helps.
Here is an example, from a user that used PolarCOM for instrument display.
http://i55.tinypic.com/2073lus.png
With the right LCD you can get the functionality of much more expensive system.
Looking at it now, I agree that digits need to be drawn better – working on it.
The vendor response is impressive. To add to my earlier comment, pretty/ugly is personal taste, readability is not. The improved 7-segment displays are better. I would pay particular attention to the decimal point, since they are often too small and they make a big difference if overlooked. Giving users a choice is always appreciated.
I know the “dot issue” all too well. Particularly unpleasant when sailing in some less familiar area and it goes from something like 10′ (close enough already) that looks like 1′ for a second there.
I tried to deal with that by making the dot in digital instrument in PolarCOM of a “diamond” shape, rather than a horizontal/square usually found on real instruments. That way it extends a bit below the bottom line of numbers. I think that makes it somewhat more visible.
I’ll make sure it’s a bigger dot too.
Here is what I’ve got so far:
http://i55.tinypic.com/2mn0ztg.gif
I installed the 1.5 versions, and both PolarCOM and PolarView work well independently, but while the instruments display position, the ship is not displayed in PolarView, and the “go to ship” is grayed out in the drop down menu. Anyone know if this is a limitation of the demo, or could it something else?
Noel, I suspect you didn’t enable Connect PolarCOMM in the Ship menu? That worked fine for me to show GPS position in PolarView.
Ben, I did enable PolarCOM, and the icon on the lower left of the screen changed color from grey to red, but no ship.
Noel,
– Make sure that you have PolarView and PolarCOM of the same major release (both 1.4 or both 1.5), they are not cross-version compatible.
– Make sure that “PolarView” port (port id 0) in PolarCOM is running. It should be running by default.
– If you are still having an issue, contact me directly by email or through feedback form on the website for further troubleshooting.
This version is much improved over the last, particularly the zoom wheel scroll and improved panning, and it’s vector display is very good.
However where it lets itself down is with the availablity of raster types, so for outide of the US is about as much use as a poke in the eye with a sharp stick. Most European Raster charts are only available in encrypted format usually .CAP files or another form from NV Verlag or memory map QCT format.
It’s a shame that these are not implemented.
It would also be nice to have a right click grib info dialogue particularly on the ww3 model, as one has to go back to the info panel to refer to what is going on. Also a grib map selector would be a useful tool via a draw box over a world map, rather than numeric coordinates.
I did try to get my AC info up, but although I got a successful login, it failed on the D/L every time.
OK I suppose it’s only £25 and shouldnt grumble, but still IMHO has a way to go before it’s even a serious contender for Seaclear at least in RoW anyway.
Steve
Steve,
– I’d be glad to implement support for encrypted raster charts but so far chart producers were not particularly forthcoming, unfortunately.
– GRIB selector does work on a chart. You press “Select” button in the GRIB Download panel, then click and drag a yellow “selector box” on a chart to pick the area to download.
Manual lat/lon entry is there primarily as a backup.
– If you are having trouble downloading ActiveCaptain POI, please contact me directly for further troubleshooting.
I tried the Polar View preview for Mac. and I think it illustrates a problem that is nearly universal with software products. They are written by software engineers for software engineers and are incomprehensible to normal users.
I installed and opened the thing to see a crude outline map of the world with tide and current information. So far so good, but where are the charts?
Try the user guide? The introduction says it is ” fast and user friendly”, really?
To start with you can’t print the user guide so if you want to reference it while you are using the program you have to keep moving windows around.
In the guide you find things like “Use available ENC user permits to order S63 chart cells” Well ‘ENC” I know, but what is a user permit? How do I get one? what is “S63”? what is a “cell”. I spent 20 minutes or so trying different keys and reading the guide but still can’t make it display a chart. Although some of your readers probably will disagree by now, I am actually a pretty smart guy and certainly could spend a few hours figuring all this out, and I might even do that some day, but I have other thing to do with my my spare time, (like sailing).
The way I look at it, the cost of this product is not $40, but $40+X hours of my time. That is a lot. If vendors expect to reach a market beyond technology hobbyists who like to tinker with these things for their own sake then they will have to make them much easier to use or at least provide documentation written for people who don’t already know as much as the guy who wrote it.
Love your site by the way, keep up the good work!
Hi, James. I’m certainly not an engineer, but I guess I’ve bulled my way into more charting programs than the average boater. I’d also guess that your comment might be some motivation for PolarNavy, or some industrious PolarView fan, to write a quick guide. Here’s a start regarding charts.
* Pan/zoom into a general area of U.S. coastal waters you’d like charts for.
* From the File menu select Chart Download.
* Click the Select button on the Download box.
* Position your cursor on one corner of the area you’d like to download, click once, drag your mouse (without holding down either mouse button) and you should get a yellow box defining area of interest. Click again to set box.
* Then click the Find Charts button next to that Select button and you should get a list of available ENCs for the area.
* Select all the charts you want with a click and shift click — or individual charts with control clicks — then hit Download, and away you go…
I am actually planning to make a short video showing how to add and download charts. Initially it was supposed to be part of the “introduction” video clip, but the “footage” was cut, since it was getting way too long.
Hopefully, in a few weeks when the “smoke clears” 🙂
I think what happens is that quite a few programs, especially for mobile platforms, are now bundled with charts. In a way that blurs the boundary between an application and its data. It is definitely convenient though, and users likely come to expect that.
There are, however, some implications to this approach – beginning with initial download size, and down to copyright issues, that right now prevent PolarView from being bundled with charts. May be one day.
Thank you Ben. It is amazing how easy it is, once you know how. What is even more amazing is that anyone thought that could be figured out from the user guide.
Nearly all technology vendors seem to ignore the users’ learning curve. Functionality that the user doesn’t know how to access might as well not exist. Most technology vendors could greatly increase the effective utility of their products if they just figured out a way to tell their customers how to use the features that they went to so much trouble to build in.
PolarNavy: Why not hire Ben to write the next version of your user guide?
James,
I have a feeling Ben might have his hands full when it comes to writing 🙂
That said, I believe that’s what the second paragraph in PolarView user guide, titled “Downloading Charts” is about:
Press Ctrl+D or select menu File->Chart Download to launch download control.
Select area by either entering East-West and North-South boundaries in appropriate fields, or using “Select” option to select the area on a chart.
Press “Find Charts” to launch Find Charts control
Select desired charts from the list and press “Download”.
I’ll be the first to admit that style may need work, but I do think it describes the process reasonably correctly.
I love what appear to e complaints from people – I for one am very impressed with PV & PC. Everyone wants to talk about dots, dashes, sizes, quirks, and downloading – hey for 40 bucks stop complaining. Personally I don’t feel PV/C was designed from the beginning to be a feature rich software but a quick and responsive easily managed software without all the bells and whistles that most of us will not use in the $400 other programs. Play with it if you don’t like it don’t buy it spend the $400 or $500 bucks for the others.
I have been following PV/C for a few years and have had different versions of it and use it for planning plotting etc. Gene has always improved on the system and I am sure he will again in the future.
I find Polar V/C to be well worth the price tag and Gene has done a phenominal job on the side with it. Hats off to you and appreciate your work – because it works… thats all just works.
John
I agree on all counts with the above, I bought Polar navy and have been taking a closer look. For one thing it’s 100% better than the unmentionionable pile of “knock-off” which is it’s nearest competitor. It now has BSB4 support which is great. I dont know whether Gene/Brack would be interested, but an English European version would be very handy. If you are still monitoring Gene then plse get in touch.I have a charting colleague who would be very interested in supporting your program for the UK/EU.
[email protected]
Cheers
Steve
I love this software. I’ve used the other Mac software for about four years now, but PV/C has changed the way I look at my onboard electronics. Active Captain on the chart is worth the whole price of admission.
My new set up on board surrounds my mac mini (macbook pro backup) with my iPhone4 and iPad (yet to be added). The iPhone/iPad run NMEARemote, which reads NMEA over TCP/IP served by PolarCOM over my onboard wifi. Instruments are fed into the net by and Actisense DST-2 and a multiplexer. It’s too cool. Plus, there’s plenty of redundancy as I already own lot’s o’ Mac gear.
I tested PV/C on a 400 mile run down the Jersey stretch from Long Island to the Chesapeake last month. Bought it as soon as I got home.
Keep up the good work Gene!
There’s a free version of PolarView for iPhone 4, iPhone 4S, iPad 2 and the “new” iPad, but not the original iPad or any earlier iPhones (so I can’t try it). It’s “admittedly quite basic”…”essentially a quilting raster and vector chart viewer for NOAA charts.” Report back if you try it please.
Would love an Android Version, unfortunately Will’s MX system doesn’t have a way of getting BSB’s into it other than downloading free ones. I’m currently using Ronald Koenig’s Marine Navigator Lite on the Xoom and Chinese Tabs, but if somebody were to write a decent raster navigator for an android tab, it would sell shedloads. Big drawback on the Marine Navigator, is that there’s no pre-fetch or quilting.
In answer to your original question Ben last year, I think it is, very much so.
Steve