
“Obstructions that cover”, the plot thickens
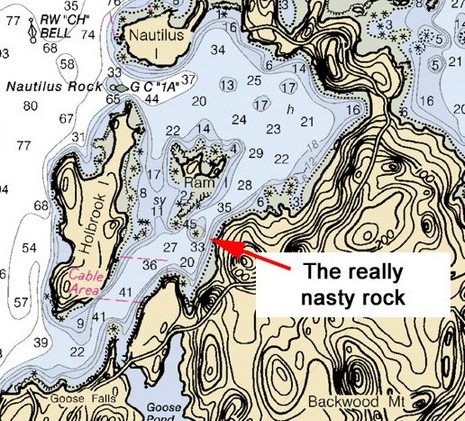
Panbo friend Jeffrey Siegel sent over an excellent example of how important those chart asterisks can be. His raster chart clip above “shows a very nasty rock just outside Castine that is exposed by two feet at low tide (and thereby lurking just out of sight for most of the day). I know of 10 boats that have hit this rock – one guy even installed a pole on it after hitting it because he was so angry (it has since fallen off). It would be completely unacceptable to have that rock missing on any chart.” Well, I’m sorry to report that this “obstruction that covers” (official NOAA designation) is completely missing from the NauticPath charts I’m testing. Query the area with the cursor and it shows a minimum depth of 12’. Not good!
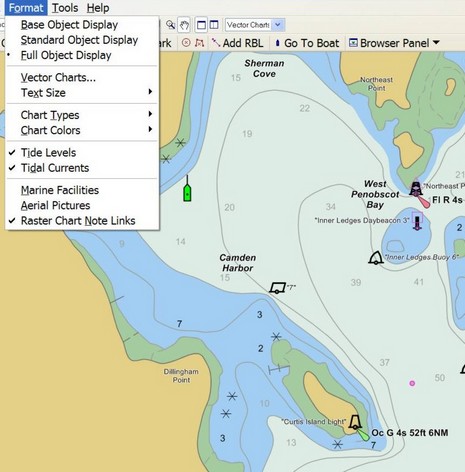
Moreover I’ve come to realize that NOAA’s own ENC vector format can be a little dicey about showing these same obstructions. There is no detailed ENC for Castine yet, but when I open the Camden 1:40,000 chart in Chart Navigator Pro (aka Coastal Explorer), the obstructions only show if I’ve set the ENC format to “Full Object Display”.
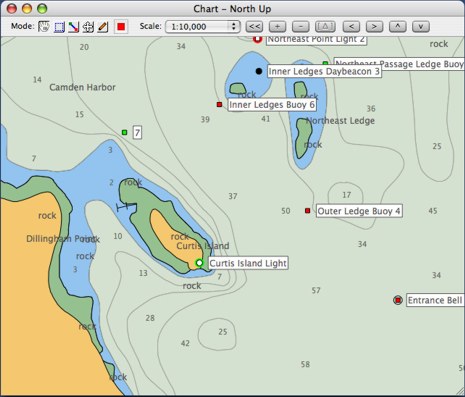
Then there’s MacENC, whose developer has for some reason chosen to show the obstructions by writing out “rock” instead of using the common symbol. I find that confusing as such words usually describe bottom composition, plus the point location of the rock is lost. At any rate, I’m going to check out how some other programs display the ENCs, and how other vector formats handle the obstructions, but right now I’m feeling very fond of familiar raster charts!
This illustrates why the world of ECDIS and ENC are so regulated. With ECDIS many chart features can be removed, but others (like rocks!) cannot be removed from the vector chart display. The way the chart is drawn is all controlled by the software. Buyer beware.
The husband of my sister from Boston, send-me a screen shot of the same place in the Garmin MapSource Blue Charts, and this problem does not hapens there.
Regards
Pascal
The ECDIS Specification states three levels of display detail; base, standard, and other. In all but the ‘other’ display mode; rocks are hidden. Also the default display mode is ‘standard’, which means that ECDIS compliant displays should not show rocks without user intervention.
Early versions of Coastal Explorer followed the specification, and based on our user’s feedback, we started to deviate from that. Starting with 1.1 we defaulted our program to ‘full object display’, and again, following feedback on this issue, with our patch released today we made changes to ensure rocks are always visible.