Data overload with Signal K Server, a Raspberry Pi and a whole lot of tools
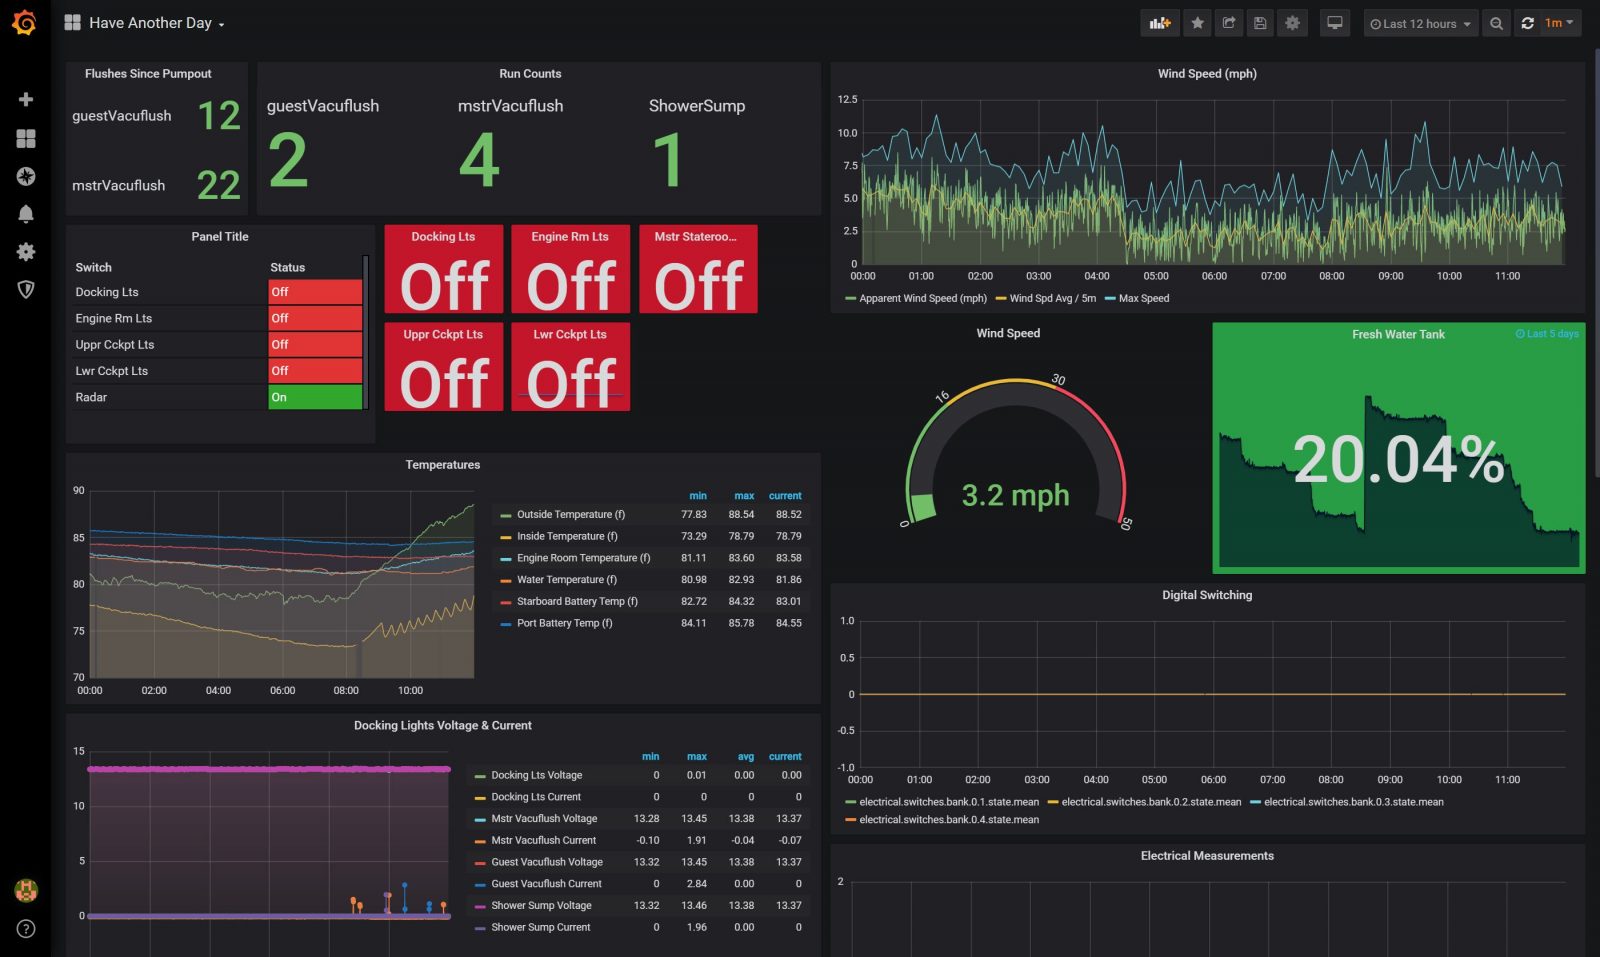
I have been wanting to explore more about what’s possible with Signal K server, and quarantine 2020 gave me the time. I’ve spent the last week or so exploring all that the server and its array of plugins make possible. I’m impressed and the dashboard you see above is just the tip of the iceberg of what it can do. If you stick with me and some geeky talk I’ll tell you about what I’ve been able to do with all the data on my boat and the tools Signal K Server offers.
Signal K (SK) is an open source standard designed as a “universal marine data exchange format” to allow boaters to leverage technology like mobile apps, automation and far more advanced monitoring. Bill Bishop, a marine electronics installer and self described skeptic, wrote of his excitement about Signal K on Panbo back in 2014. The idea behind it is to get boat information into a format that can be easily consumed by any software or hardware that’s interested in it. Signal K is not just open source but free; which is, in part a response to the fact the National Marine Electronics Association charges for the detailed NMEA 2000 specification.
Signal K Server
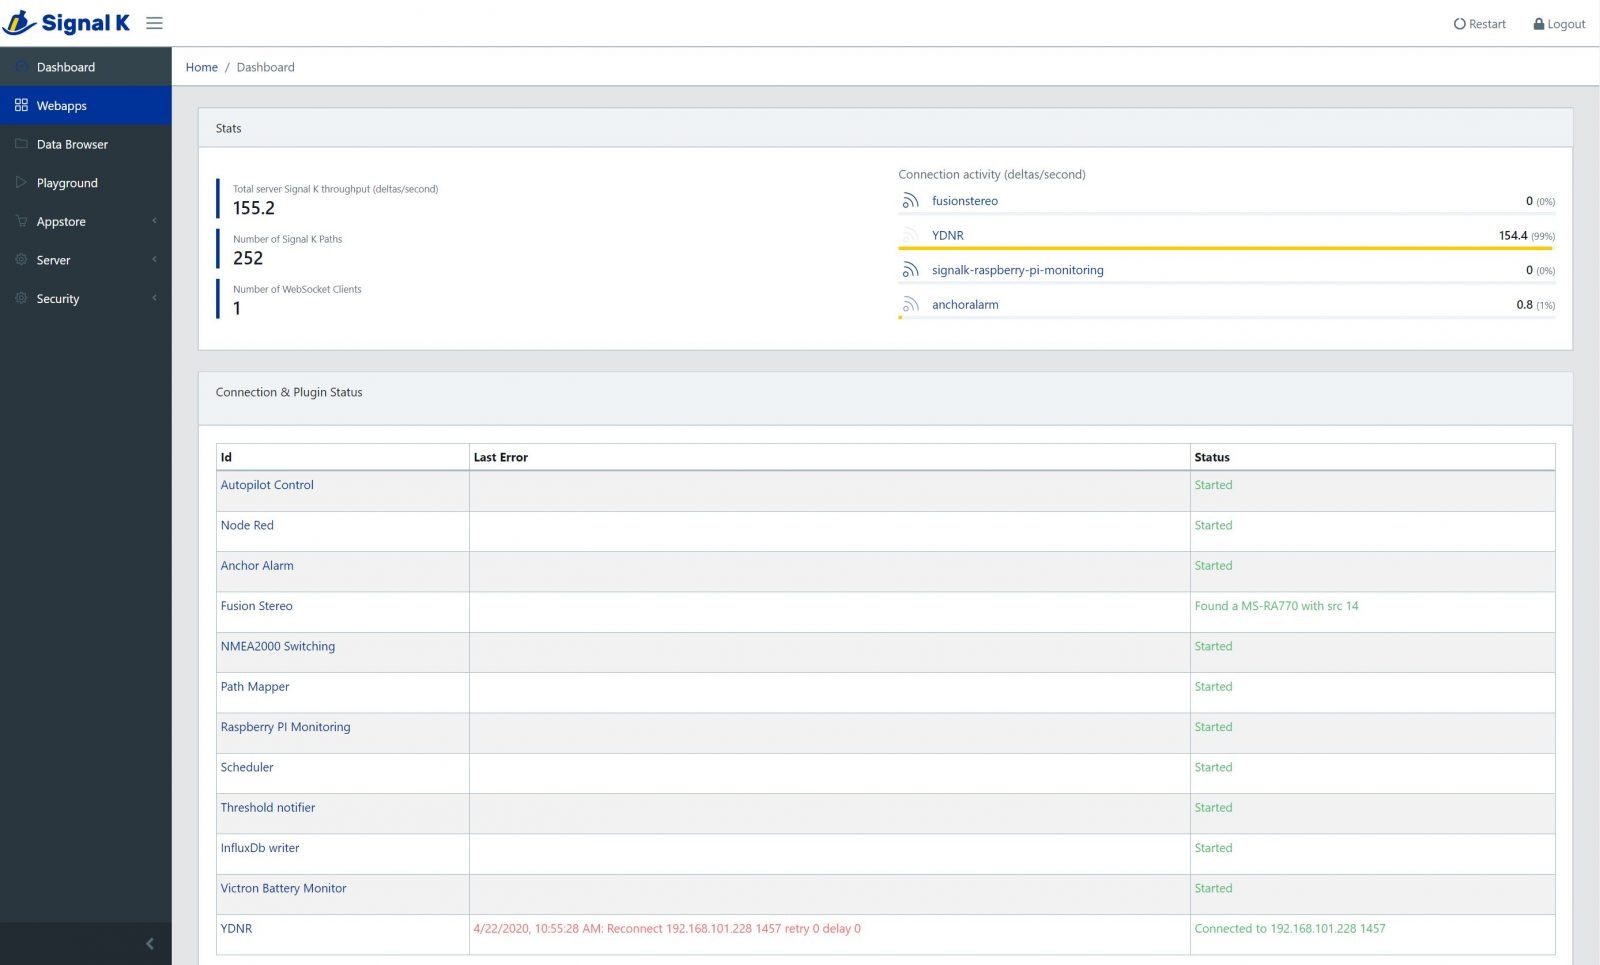
Signal K Server (SKS) acts as the hub of everything discussed here. SKS collects data, converts it to Signal K format and then makes it available to plugins within the server. As you can see in the screenshot above, there are quite a few plugins running. Some of the items listed under connections and plugins are data sources while others do something with the information once it’s already in the server. We’ll talk more about the plugins that process the data a little later. I’m using a Yacht Devices YDNR-02N NMEA 2000 router‘s TCP data stream to send data from my NMEA 2000 network to the server.
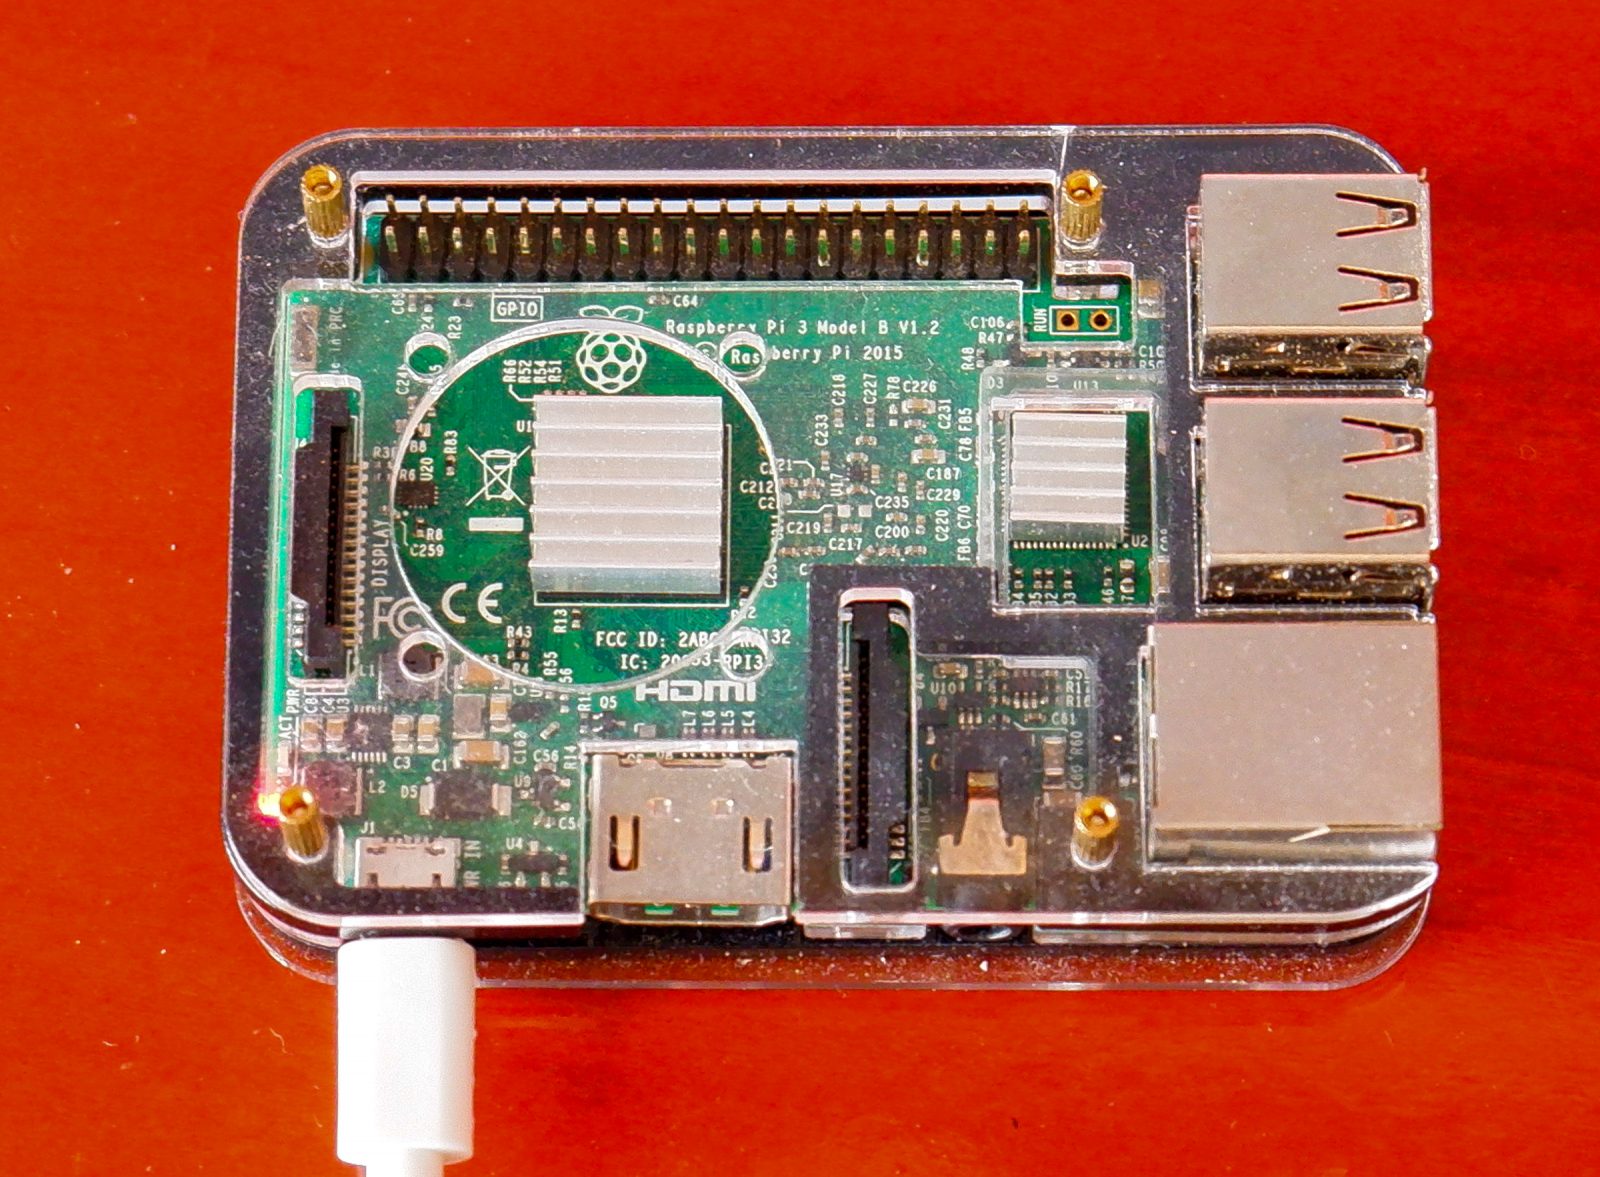
I use a number of Raspberry Pis onboard Have Another Day to perform various tasks — and to give me a platform for experimentation — so installing SKS on one only took a few minutes. With the server installed my next task was getting data flowing into the server from my network. I have a Digital Yacht iKommunicate — an early NMEA 2000 and NMEA 0183 to Signal K gateway covered by Ben E. — on board so it seemed like a natural fit to use that as a data source. Some time fumbling about with that proved frustrating and ultimately unsuccessful. Further consultation with members of the Signal K team suggested the stream coming from one of my NMEA 2000 to WiFi gateways would be better. So, I began using the TCP stream of a YDNR-02N.
In the process of getting data into my server, I came across a small syntax error in the SKS code that was causing my connection to die periodically. After discussing with the Signal K Server team I made a small change to the code and was off and running. I mention this because it’s worth noting that these are still early days for an open source effort composed of volunteer developers contributing to a non-commercial product for the good of other boaters. While working with the SK team on a few new features and issues I’ve been really impressed at how quickly features and fixes are implemented; usually only taking an hour or two.
InfluxDB and Grafana
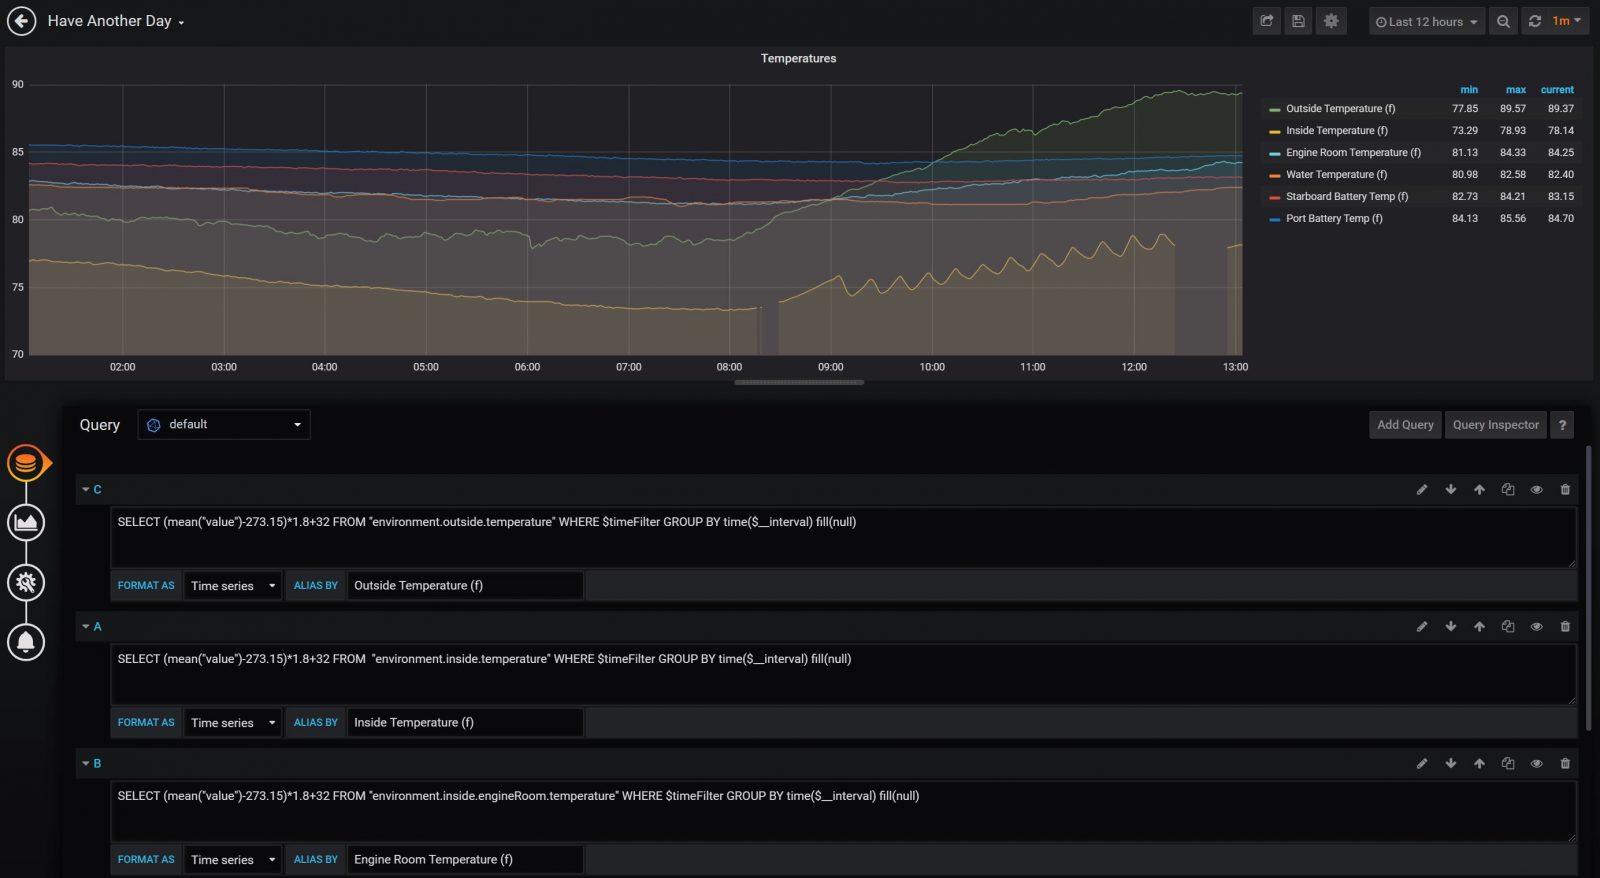
The good news is that the server had data flowing into it, but it wasn’t doing anything with the information. One of the main reasons I’d invested the time in Signal K Server was to find a better way to visualize the myriad data available on my NMEA 2000 network. Drawing back to my previous life running computing infrastructure I’ve long used time series databases to collect statistics and graph them over time. Time series databases are designed to efficiently store time indexed data and allow quick retrieval while also performing calculations, filtering, and analysis.
It turns out Teppo Kurki, a core SK team member, wrote a plugin that sends data from the server into InfluxDB, an open source time series database. Once it’s stored in InfluxDB, the next task will be to display the data. The Signal K community seems to have embraced Grafana, an open source (are you starting to notice a pattern here?) visualization platform that allows you to create dashboards from many different data sources.

Grafana makes creating pretty pictures quite simple with a number of built-in visualization options and the ability to add more through plugins. I’ve used the graph, stat, gauge, singlestat, and heatmap visualizations quite a bit in my dashboard. Collectively they offer a great deal of flexibility about how you display data and make it so it can be quickly understood.
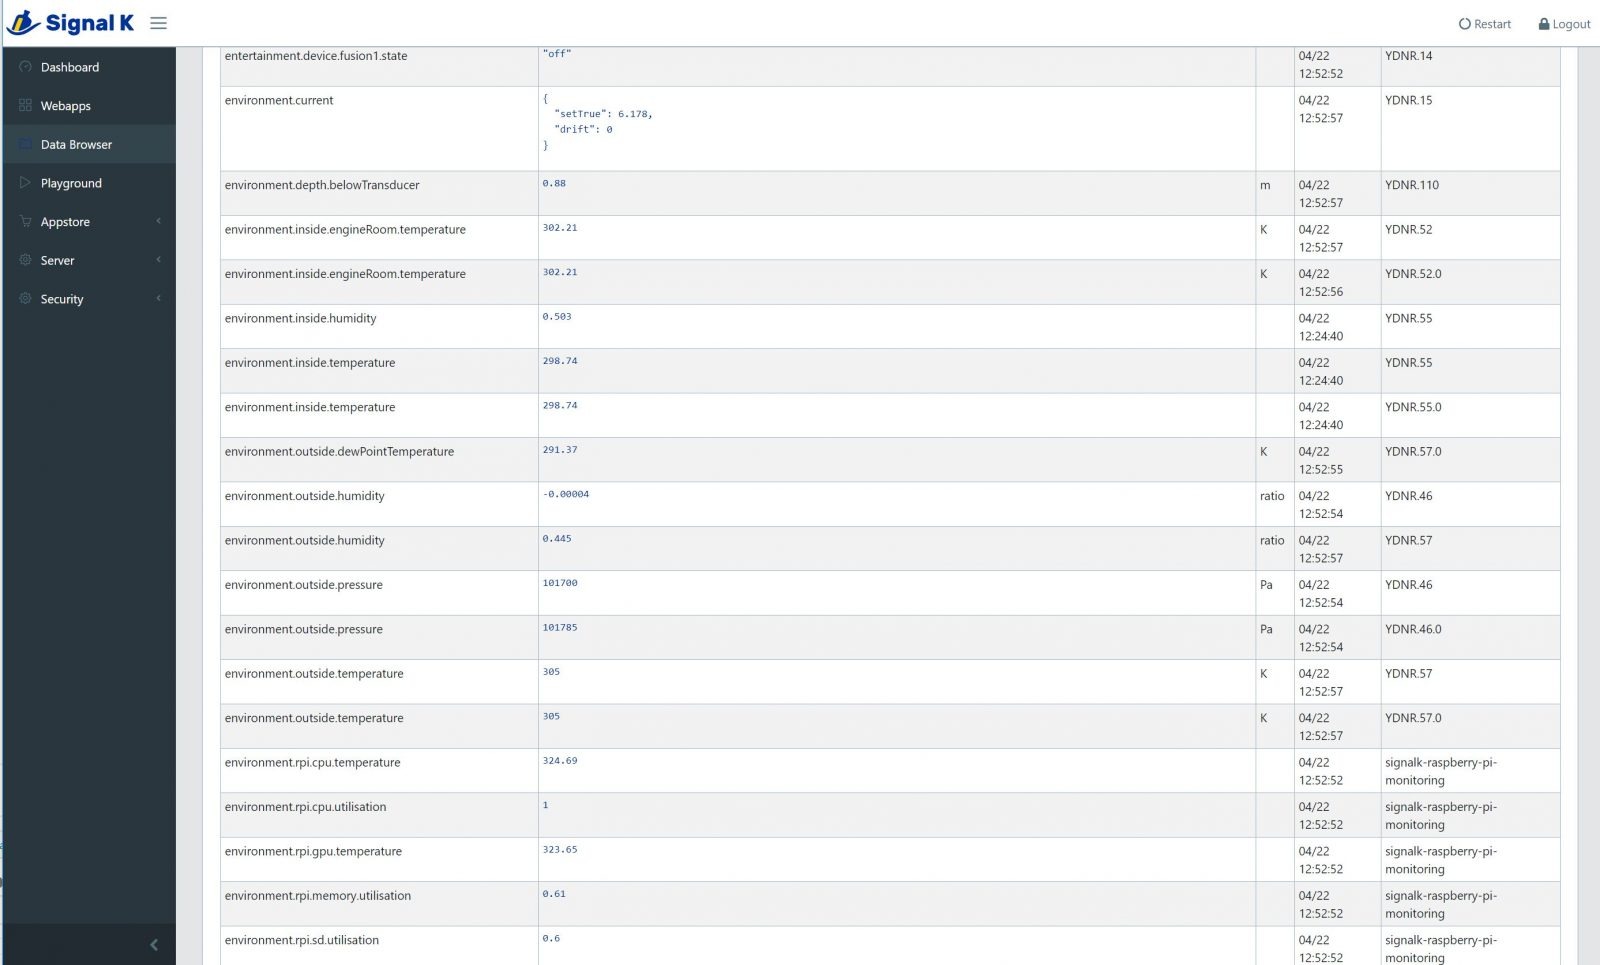
Above you can see examples of the ways information can be presented. Data types in Signal K all conform to the International System of Units (abbreviated as SI) so in order to display data in local units some calculations will be needed. For example, all temperatures are stored in Kelvins, but I’d prefer to display temps in Fahrenheit as it’s easier for my American brain to understand. So, each Kelvin measurement must have 273.15 subtracted from it, then be multiplied by 1.8 and finally add 32 to get the Fahrenheit value.
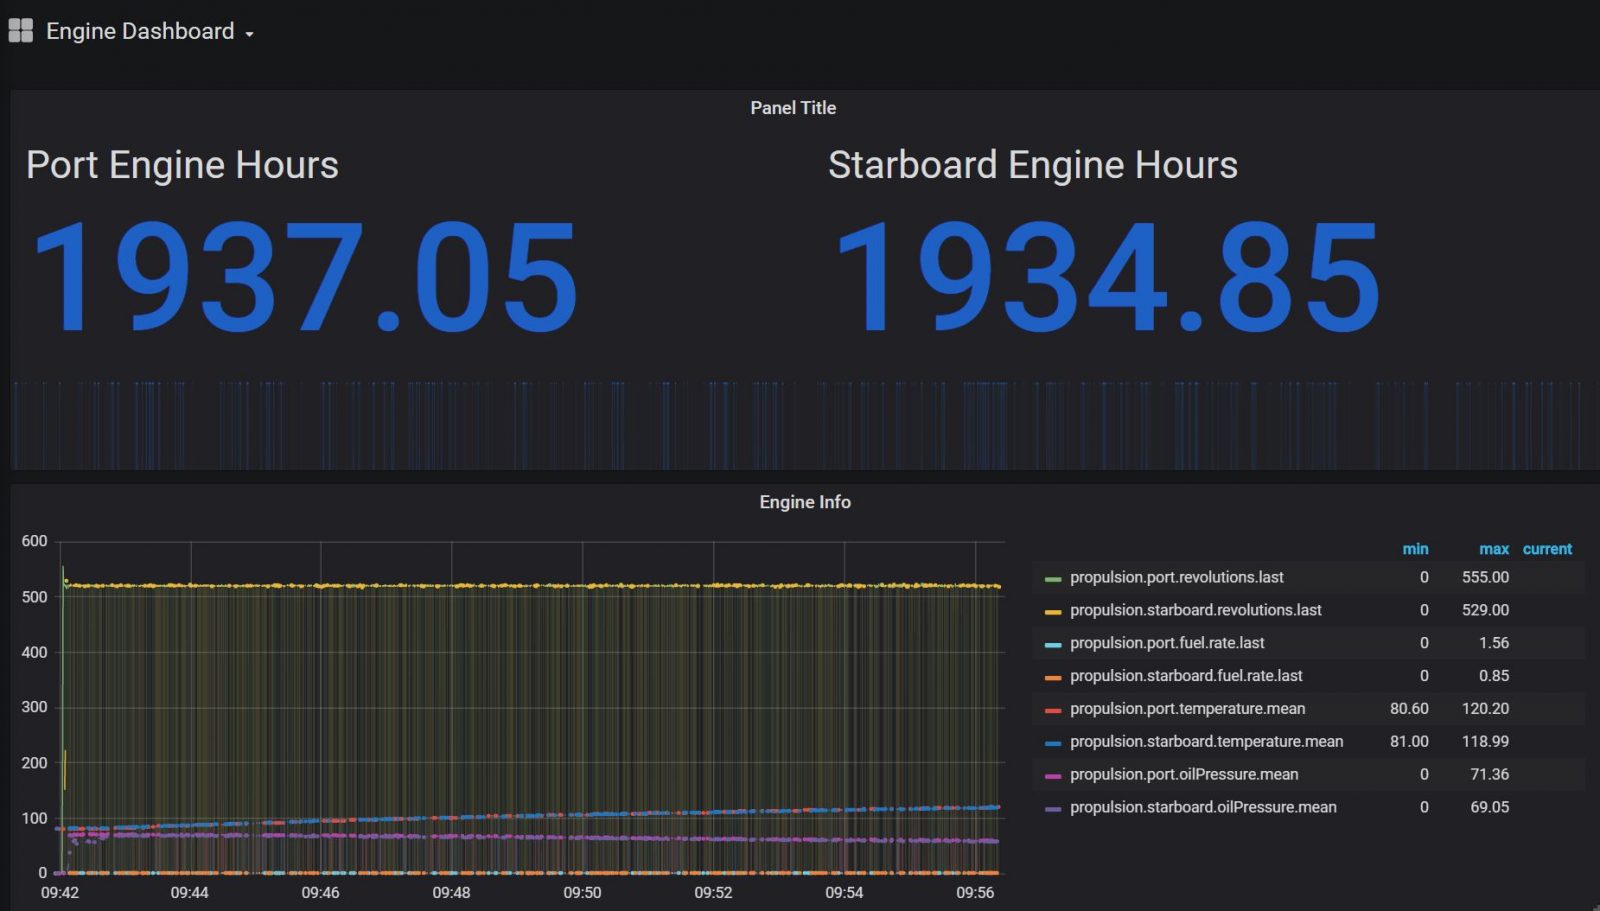
Any information that’s available on the NMEA 2000 network and understood by SKS will be included in the data-stream. As a result data from my engine gateways is included in the stream and written to InfluxDB. This gives the ability to graph and record the data so you can go back and analyze it later. I think this easily accessed information could be especially useful in the event of some sort of engine trouble. If, for instance an engine overheated you could look to see if this was a very gradual rise that eventually tipped over a threshold or a sudden event. That would help quickly steer troubleshooting.
Node-Red

My goal in installing SKS was to display data more effectively. But, once I’d installed it and saw all the things it could do my wheels started turning. Some of my early reading about Signal K mentioned Node-Red integration. I was vaguely familiar with Node-Red and its visual representation of functional flows. These flows allow you to visually chain together blocks that can represent inputs, functions, and outputs. This seemed like an opportunity to enable some automation that I wanted but hadn’t found a good way to achieve.
Since installing digital switching I’ve wanted to automate control of some of my circuits. I use an automation suite at home to turn circuits (mostly lights) on and off either at set times, at sunset, or in response to other events. But, I hadn’t been able to find a good way to do that using the NMEA 2000 components on the boat.
In the screenshot above you can see several individual flows defined. The topmost one consists of a neon green node (that says “Control Cockpit Lights” and then has a virtual wire connecting it to a yellow output node called “Lwr CckPt Lts”. The neon green node is a timer that is set to send a turn on message 15 minutes before sunset and an off message at 11:00pm. The yellow block is a Signal K put node which allows sending commands to Signal K nodes. In this case the node’s path is set to “electrical.switches.bank.0.4.state” which is the digital switching circuit controlling those lights on Have Another Day.
You may have noticed that “electrical.switches.bank.04.state” doesn’t exactly roll of the tongue. There’s an SKS plugin called Path Mapper, written by Scott Bender (of Wilhelm SK fame), that allows you to name that something more friendly, like “electrical.switches.cockpitLights” but, because of my often reconfigured switching environment I’ve decided not to rename my circuits for now.

Next up was a notification tool for filling the fresh water tank. I have the attention span of a gnat. So it’s not at all unusual for me to forget the fresh water is filling until I glance out and see the hose sticking out of my water fill with water spilling out. My fresh water tank is well monitored by a Maretron FPM100 so the tank level data is on the network. Wouldn’t it be handy if the server alerted when the water is almost full? The flows above alert when the tank reaches 90% followed by reminders at 95% and 99%. These alerts come in via e-mail, and since I nearly always wear my Garmin Quatix watch, my wrist buzzes each time I receive these messages and my tiny attention span is reminded to check on the water filling.

I’ve also been able to add a few flows leveraging other data on the boat. For example, if the engine room lights are on for more than 10 minutes I’ll get an email, followed by a reminder every 20 minutes, followed by a confirmation when they’re turned off. I’m also using information coming out of a Yacht Devices Run Indicator (YDRI) connected to my Vacuflush vacuum generators. If the toilet doesn’t seal well the Vacuflush generator can run continuously or cycle frequently. I’ve defined rules in the YDRI to turn on an alarm channel in the event that happens. Node-Red is then watching the alarm channel and emails me if an alarm is raised.
Final Thoughts
I think this is an incredible amount of functionality at any price. But, when you consider I’m using a $35 computer and all open source software that hasn’t cost me a dime it becomes even more incredible. The installation of all this software does require some basic Unix / Linux skills, but there are good tutorials available for each step of the process. Many of the individual things I’ve done can also be accomplished using other tools but so far Signal K Server and its plugins represent the most flexible, Swiss Army Knife-like set of tools I’ve found.




Glad you like it. The trick about open source is that is a better model for building on works from others than closed software. We’d never have been able to do this if we had to write all of it.
Anthony Baker linked to his interesting Signal K boat data system on our Facebook page, and I was particularly encouraged by this background bit (my boldface):
“Being ever curious, an idea of an in-depth data collection system came into focus. Research, along with a lot of trial and error, I got a Signal-K (http://signalk.org/ ) Server running on a RaspberryPi. (Before this started I did not even know what a RaspberryPi was.) ”
http://a2baker.com/magnoliablog/?p=11905
I also heard from the Bareboat Necessities guy who spent a lot of time carefully documenting his RasperryPi-based boat electronics system (though I lost his name/email ;-(
https://bareboat-necessities.github.io/my-bareboat/
I’d missed that detail in his post but I agree, it’s a great indicator that some basic technical skills and following many of the good install guides can get you up and running without a Phd in any of the technology.
This link may be of interest on this subject. https://www.youtube.com/watch?v=a6mjt8tWUws&t=949s SKS for Docker
https://hub.docker.com/u/signalk/
Ben, you can show how to create a working connection to YDNR-02N for the signalK server.
Christopher,
THe YDNR would provide the data stream into Signal K server using a connection type of Yacht Devices RAW TCP or Yacht Devices RAW UDP depending on your NMEA server is configured in the YDNR. The job the YDNR, YDWG or YDNU does in all of this is pretty simple, it’s just the transport mechanism to send data from your NMEA 2000 network to Signal K server. It’s a simple function but without something doing the job your server doesn’t get any data.
-Ben S.
There is some good information regarding Raspberry Pi boating projects on https://www.sailoog.com/openplotter. The OpenPlotter software suite includes many useful boating functions (OpenCPN, Signal K etc.) in one package for the Raspberry Pi. The documents section for OpenPlotter 2.0 contains links to several built projects under “examples”. https://openplotter.readthedocs.io/en/latest/getting_started/downloading.html . There is also an OpenPlotter forum http://forum.openmarine.net/forumdisplay.php?fid=1 . Powerful stuff but it requires the user to have some tech knowledge to get it all working.
Everything works fine, I asked a question because Ben wrote
” Further consultation with members of the Signal K team suggested the stream coming from one of my NMEA 2000 to WiFi gateways would be better. So, I began using the TCP stream of a YDNR-02N.
In the process of getting data into my server, I came across a small syntax error in the SKS code that was causing my connection to die periodically. After discussing with the Signal K Server team I made a small change to the code and was off and running. ”
I asked what the problem was with YDNR-02, mine works very well.
The fix I mentioned has been incorporated into the Signal K server code so others won’t have the same problem I did. The problem only showed up when specific traffic came across my NMEA 2000 network. In my case it was AIS messages that the Signal K Server code choked on. There was a small problem in the error handling for these messages that caused the connection to break.
-Ben S.
Thank you Ben S.
I have the ability to install and provision these type of system in days. Please contact me for assitance.
Great article, Ben! I’ve been using Signal K on my trawler for over a year, collecting data from a number of sensors connected to wifi-enabled microcontrollers (ESP32 and ESP8266), with the SensESP sub-project of Signal K.
How did you get the big red “OFF” display in Grafana? I have a bilge pump monitor that sends a 1 or a 0 to Signal K, which then goes to my InfluxDB and eventually Grafana, but I’ve not figured out a way to display ON or OFF based on a 1 or a 0 (or true/false – not sure what’s being sent to SK).
Are you able to get audio alarms for things like battery voltage from the server?
Ray – yes, you are able to get alarms for any data that’s in Signal K. You can set different alarms for different thresholds – alert, alarm, emergency, etc. I have them set up for battery voltage, bilge pump going off, coolant temp too high, and raw water exhaust temp too high.
Hmm, I’ll keep digging into things. I’m just not seeing a way to do it. Maybe because I’m running it on windows.
Ray, you need to add the Simple Notifications plug-in. Signal K has countless enhancements that are implemented as plug-ins. I suggest you join the Signalk-dev discussion at Slack, where you can get an answer to any question imaginable.
Ben, Have you installed SignalK 2.0.0? It seems to trash a number of paths. Specifically electrical is showing about 30 battery banks with seemingly random keys.
I haven’t yet but will spin up a test installation and take a look.
-Ben S.
thanks Ben. I also pinged Scott, and I owe him some logs. Please do let me know what you find.