
C-Map’s hyper harbor detail, & more charting/POI news
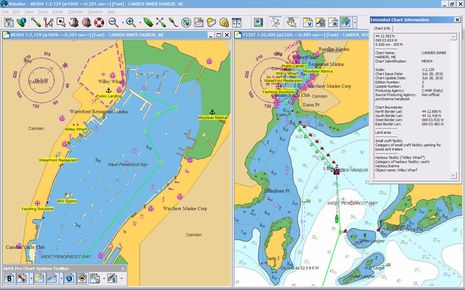
Testing Nobeltec Admiral 11 is going pretty well, and I’ll write about it soon, but what really got me grinning is the latest C-Map Max Pro chart of Camden Harbor that came along with the trial software. I’m a long time fan of C-Map’s C-Marina concept — in which cooperating marinas are charted in super high resolution — but in actuality C-Map’s earlier attempts at Wayfarer Marine detail were seriously flawed. Well, not only is Wayfarer now exceptionally well depicted (with one major exception), but other improvements make C-Map’s the best visual guide to my harbor’s complexities yet created, I think. Please click on the image above for a full screen window as I explain…
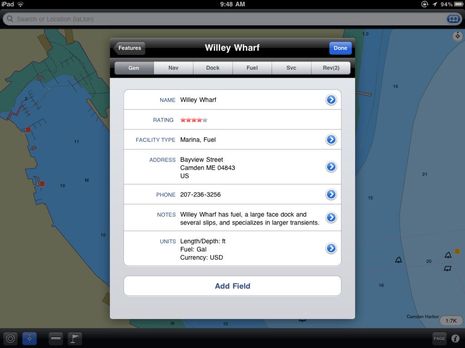
As anyone familiar with Camden Harbor can tell you, C-Map now has Wayfarer’s main docks accurate nearly to the individual ramp and float level and, most striking, they’ve charted all 32 of the private two-boat inner harbor mooring floats. They even put the slight skew in Gizmo’s home float that you can see on a typical satellite photo map, which is probably where they got the information (incidentally, an adjustment to the northern mooring stone took the skew out last spring, but the sat photos haven’t nearly caught up yet). While some critical harbor businesses like Willey Wharf are still mislocated — which I’ve corrected with yellow markers (head’s up, C-Map cartographers 😉 — this is still the best Inner Harbor chart I’ve ever seen. And while I may be obsessive about Camden detail, it does matter.
In fact, that route I created in Admiral 11 is exactly the path some visiting yachts as big as 100 feet take before backing into the Public Landing, and that’s got to be a hairy proposition for a skipper who’s never seen the harbor before (and can’t see beans from outside). And look at how beautifully C-Map charted the private aids we use to mark the channel between the two Outer Harbor mooring fields! That’s exactly what they look like — 5 mph speed pylons with a series of un-numbered red and green lateral ball buoys — and a far cry from the way NOAA charted those aids. Could it be that C-Map was reading my Panbo rants about NOAA’s work? Well, the 7/28/2010 Issue date associated with some of this “non-official port/marina” data” does correspond.
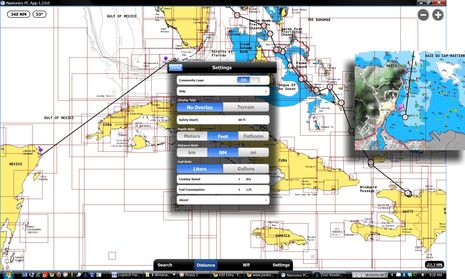
That massive chart portfolio would have only cost $35 if I hadn’t had a voucher, and apparently anyone who has a recent chart card covering that area will have free access to the PC app for planning purposes. I think the app — maybe along with a Navionics card reader — may also be the eventual gateway to getting data updates on the card. I wish Navionics had clear information on their site about what’s happening, and specifically how the whole PC App download process works, but I can tell you that it went well for me on a Vista 64 bit machine (and it’s supposed to be Mac compatible too). Click and gander (and perhaps enjoy as I did retracing my March, 1974, cruise north from Cap Haitien, which had NO nav aids then):
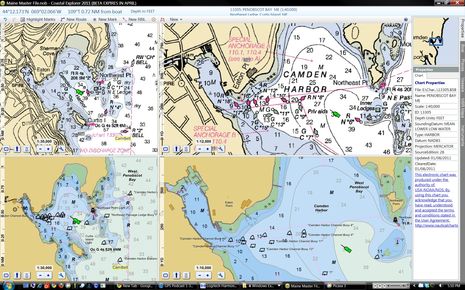
on of Camden Harbor chart 13307 has had the channel buoy mess corrected, even though they were updated recently. Sigh. If you look on the zoomed-in ENC at lower right below, though, you’ll see the Wayfarer marina docks that aren’t on the Google sat map yet and that C-Map missed (no cartographer has yet adjusted for the massive dredging). Note also the difference between Northeast Point at upper right on the ENC compared to the traditional shore line seen on the 13307 raster in the window above it. I tried hard to get NOAA to reverse that decision, but damned if the new 1:40,000 scale raster (upper left) doesn’t also have the point as an island. It’s certainly not a critical detail, but one day we will have to discuss how NOAA came to that faulty conclusion.


PS One complaint I have about the C-Map Max Pro charts are the way spot soundings are presented. For instance, I don’t know how 10 feet on the official NOAA charts becomes 9′ 10″ on these and some other charts, and I’m not worried about the 2″ difference, but I think that the 9/10 type sounding is a waste of chart space and user brain cycles.
I just installed Navionics Marine&Lakes: USA HD, and it shows spot soundings fine. But even the charts I just downloaded from a Navionics server do not include the Camden shoreline detail and private channel buoys (however misrepresented) that NOAA started publishing more than six months ago.
Hi Ben,
The reason the C-MAP MAX Pro charts present the spot soundings as Feet / Inches is because C-MAP stores all data in their core database in Metric values (i.e. meters). Once the data is installed on a navigation computer and is then rendered to the screen the C-MAP software (called the MAX Pro Run Time Environment) has to convert the spot depths from meters to feet.
It has been explained to me that the way C-MAP stores data in metric values in their core database is the international standard for S-57. And that the resulting discrepancy in the spot soundings on the chart is a necessary by-product of this conversion that their cartographers do.
Regards,
-Bill Washburn
Nobeltec
Thanks, Bill, but how about rounding those feet/inch spot soundings to the nearest whole feet? In fact, a recent Jeppesen press release photo seems to show some sort of display software — probably C-Map’s own — doing just that for all soundings greater than 10′:
http://www.sail-world.com/USA/Jeppesen-C-Map-Announces-New-Gr-Lakes-&-Trent-Severn-Aerial-Photos/79672
I’m not sure what the value is of even showing inches in depths under 10 feet, unless the detail is related to real underlying data accuracy, but on this display the inch number is faded, making the feet easier to read at a glance.
That is very interesting to see the C-MAP / Jeppesen MAX rendering of the spot depths. We (Nobeltec) have been requesting this change to the way spot depths are rendered for many years now. But it has been deemed not important enough to Jeppesen to make improvements to MAX Pro.
The MAX Pro Run Time Environment (the underlying engine responsible for drawing MAX Pro charts) controls the way all spot soundings are drawn in Nobeltec VNS and Admiral software. The change of how those spot soundings are drawn would have to be altered by C-MAPs programmers and then redistributed to OEM partners such as Nobeltec and others who use MAX Pro in their navigation software.
It is a good suggestion.
-Bill
Any news on when one of the mobile OS (iOS, Android, WinMo7) are going to have support for IP Based RADAR like the Koden RADARpc ?
-p
That should read
Any news on when one of the mobile OS (iOS, Android, WinMo7) NAVIGATION Apps are going to have support for IP Based RADAR like the Koden RADARpc ?
It’s not the OS, that needs to support it. The Nav Apps do…
-p
Nope, and I’d be surprised if it happened very soon, if at all. I can see mobile tablets as slave displays to PC charting programs running radar, though apparently that’s a bit tricky to do well right now:
https://panbo.com/archives/2010/10/more_on_ipad_as_extra_nav_screen_from_nobeltec_.html
Then again maybe a tablet running Windows 7 and a program like Nobeltec or CE could connect to radar via WiFi. I don’t think the current mobile OS’s and apps have the horsepower to run radar, and I’m not sure what the point is anyway. Don’t you want to monitor radar right at the helm where you can take action, and doesn’t a fixed display make more sense there?
I’m not sure of the CPU or GPU requirements for RADAR rendering on a PC (or any) HW Platform. When I get my koden RADARpc installed (which I bought at the Seattle Boat Show) I’ll get some perfmon numbers for windows together.
With due respect to my ignorance my assumption is that the next generation iPAD is going to be plenty powerful.
http://goodereader.com/blog/tablet-slates/apple-ipad-2-to-have-a-sweet-dual-core-1-2-ghz-processor/
Fixed display on a sailing vessel generally means at the pedestal and also means one you can’t see where you usually hold watch or drive the boat at the combing or the dodger (on passage). Clearly in fog where you are not sailing then yes the powerboat\sailboat scenario becomes one in the same, but in an ocean cruising sailboat where RADAR is used to look for traffic and squalls a mobile form factor could be ideal.
You could use a Windows 7 Tablet today to do this. Like on the Asus EP121 Slate
http://windowsteamblog.com/windows/b/windowsexperience/archive/2011/01/04/hands-on-with-the-asus-ep121slate-pc.aspx
I’m just curious when other options will start to come online. It’s inevitable that they will, just a matter of when. It will probably require the iPad2 HW or an Android Tablet to see it on a non-window tablet.
All fun stuff to anticipate!
-p
I disagree with the assertion that the current crop of iPad’s, Droids, Samsung Galaxy Tabs, Blackberry Playbooks, iPhones, Window Phone 7’s, or even Palm Pre’s don’t have enough power to display, overlay, and integrate radar data in real time. They do.
2011 is going to be an incredibly interesting year.
The assertion was made lightly, Jeff, not to worry. And please realize that I’m all for radar sensors that can be used on whatever displays their owners want to use. But I just don’t see much movement in that area.
If you have Coastal Explorer you can use “AirDisplay” from Avatron loaded on the iPad and computer to wirelessly display any PC program on the iPad essentially making the iPad a secondary monitor. If you have Rose Point’s Radar I’m sure this will display on the iPad as well. The iPad touchscreen also acts like a mouse so you have control of CE from the iPad. This is functional now and has been tested by Rose Point.
I question the safety of driving a boat from a position that impairs reading the instruments in conditions that require them. Comfort and habit aside, I wonder if the goals that necessitate a perch on the coaming should be tempered by caution, particularly when standing a night watch.
Proprietary; ie vendor specific, generated and owned; harbor detail is interesting. But what I would like them to do is take advantage of public data and show the boundaries of mooring fields.
New England, much of SoCal and now Florida is chock full of mooring fields. If you look at any NOAA raster chart, very few, almost none of these are shown with even an anchor symbol.
But all of these mooring fields are defined somewhere in city or state data because the mooring field owner had to apply for a lease of state lands to create that field. This data should be accessable by the charting companies.
Why do I need to know this? To know what is a likely anchorage and what is filled with moorings. Active Captain is a big help here and if there is an anchorage noted, it is very unlikely to be in the middle of a mooring field. But I would also like to be able to see the formal boundaries of a mooring field. Many times there is room to anchor just outside of the field and Active Captain doesn’t show that area as a possible anchorage.
David
David – you’re right. Towns are growing mooring fields all over the place. We see new data being added all the time attempting to point out the slivers of space left on the edges for anchoring. Anchorage markers are being edited left and right with that info in ActiveCaptain. St. Augustine and Cuttyhunk are good examples off the top of my head. More is needed – tell everyone to update it!
Ben – I predict a direct radar interface to a pad-like device this year. Screen sharing is, well, yeah, OK, but it doesn’t really give the right experience and performance doesn’t seem good enough with the current solutions.
I agree, David. For instance, it seems odd that publicly permitted marine construction projects — like the dredging at the head of Camden Harbor or the big breakwater in Jonesport — don’t get easily incorporated into NOAA charts. I think the detailed engineering plans are in the public record and usually approved by the Corp of Engineers, who could easily pass them to NOAA, wouldn’t you think?
It seems to me that charted Anchorage Areas are confusing. The two Special Anchorage Areas in Camden are mooring fields and the (small) space for transient anchoring is outside those boundaries. The same is true of the Special Anchorage area in Rockland, but the two regular Anchorage Areas there are mostly open to transient anchoring but do also contain some large vessel moorings. Plus Rockland has a whole lot of moorings that aren’t in any bounded area. I recall, by the way, that a central reason that Camden applied to the USCG to establish those Special Anchorages was so that vessels there wouldn’t be required to maintain anchor lights (though virtually none did anyway ;-).
Jeff, I’m going to guess that you know about some specific project I don’t. And it sounds interesting! Will this radar interface work with multiple operating systems and/or applications?
Multiple operating systems and/or applications? I think the day will come when we’ll look at that question and remember how crazy it was that we lived in that environment. Could you imagine creating a laserjet printer today that only worked with PowerPoint? Or only attached to a Lenovo PC?
Radars should be WiFi servers. They should allow multiple devices to connect wirelessly and view the data streaming down in known, standard, open formats. The only cable in a display/pad/phone should be an optional power cable. I should be able to view radar on the TV in my stateroom. Picture in picture, even.
I don’t want fewer wires between my displays. I want no wires.
It shouldn’t matter what size the display is. Applications should resize themselves to the hardware – iOS with the iPhone and iPad have demonstrated how wonderful a universal app is where a single executable runs on both devices even if it has a different user-interface on the larger screen. Android 2.2 and the upcoming 2.3/Honeycomb makes that simple to accomplish there as well.
None of this is state of the art stuff. It’s “state of the practical.” And these types of architectures are going to change the way we use electronics on boats.
The gospel according to Siegel! All very compelling, Jeff, but one or more of the companies that has its own marine radar technology and manufacturing — which doesn’t seem easy to develop — has to be agreeable. I don’t see any signs of that.
Heck, I’d be pleased if someone other than Koden opened their radar to third party PC charting developers, which would make that niche more competitive and probably more interesting. An open standard radar scanner/server sounds wonderful but may be a pipe dream for at least the near future. I’d like to be surprised, though 😉
Optional Power Cable? Wind is Free, Radar should be Free as well right???
Tell Jeff to come down from the Ether. HaHa…
I’d have to agree with Ben and disagree with Mr. Siegel. Boat electronics is not a PC market place nor is it consumer electronics.
The idea that cheap, virtually throwaway tablets etc will have a place on board a wet saltwater environment, in any other mode then letting th ekids play games, is pie in the sky thinking.
As to open radar or open anything, theres simply no commercial reason to do it, most usres are nowhere near tech savy enough, they just want to buy a plotter from X connect up X’s radar and go sailing.
I can see possible reason to have a portable tablet showing radar, Are you suggesting I hold it in my wet gloved hands all night!, while the rains pours down and the sea breaks over me….. ( BTW try the ipad with gloves …..!!).
Sorry Jeffrey, the marine electronics market is tiny and will never respond like you would like.
Dave
> Sorry Jeffrey, the marine electronics market is tiny and will
> never respond like you would like.
I was deeply involved with Xerox PARC Smalltalk in 1982. Four companies were given free licenses to it – Dec, HP, Apple, and Tektronix (I was at Tek). I met a guy named Alan Kay in those years who made one of the best and most appropriate quotes for situations like this: “The best way to predict the future is to invent it.”
Here’s to the future…
Amen Jeffrey !!
Nice stuff, but I think that Nobeltec is pricing themselves out of the recreational market. $499 for a megawide of New England !!! INSANE Plus I’m assuming that the won’t support the NOAA ENC format since the version I’m using (Ver 10) won’t show them
Sorry, I think the’re pricing themselves out of the market.
Hi Dan
May I clarify something?
It is Jeppesen / C-MAP who makes the MAX Pro charts. They price the data at $499 for a MAX Pro Megawide region – Not Nobeltec.
Nobeltec is just a reseller of Jeppesen data, and we are obligated to adhere to their pricing model.
Additionally, it was Jeppesen leadership that forced Nobeltec (when Jeppesen owned Nobeltec) to remove S-57 chart support from our applications.
Now that Nobeltec is no longer a part of Jeppesen we fully intend to correct these issues.
Please do understand that Nobeltec is committed to providing access to high quality and affordable data. In fact in VNS 10.7 and Admiral 10.7 we removed the infamous Raster Plus Pack that Jeppesen management forced upon us. And we have even gone as far as providing a FREE NOAA Raster Chart Library to all VNS and Admiral v10 and v11 customer. We do this to underscore our commitment to supporting NOAA data.
Again, please understand that the MAX Pro chart region pricing is set by the manufacturer of the data – Jeppesen / C-MAP, not Nobeltec.
Regards
-Bill Washburn
Nobeltec
Bill,
Thanks for the response. I realize that the cartography is provided by C-MAP, but look at it from my point of view. I have VNS 10, to upgrade to 11 I have to spend 199.00 for the upgrade, then I have to buy new cartograph for $479.00 (Landfall) for new charts since my year old Passport charts will no longer work. So my cost is now 678.00 to upgrade… or I can change to another program with cheaper cartography.
Interesting to know that many of the other onerous changes were forced on you, and I sympathize…BUT VNS is a SYSTEM, comprised of both the navigation program and the cartography, so when I assess the cost of an upgrade, I must consider all the components. At $678 it becomes necessary to consider ALL options including other platforms, which would mean Nobeltec would lose a customer. Another option is to skip the upgrade and wait until S57 support returns.
The real issue is $479 is not really a good price point for cartography for the recreational boater. I do appreciate your response however. The product is fantastic, and I hope there will be options on the cartography front.
Dan
Dan: we vote on price with our checkbooks. Apparently, a publisher would rather sell a dozen $500 packages, and have only a dozen users to support, than sell a gross at $42 and have to put in 6 more telephone lines! The App Store price phemona doesn’t come without a price.
Hi Dan
I do understand. That is precisely why we do support the NOAA Raster Charts – which are FREE.
Therefore the upgrade for you would only be $199.
And, if a customer already owns VNS or Admiral 10 with vector charts that would mean that the customer already has MAX Pro charts on their system, and there is no need to pay for additional cartography. The upgrade to VNS 11 or Admiral 11 has nothing to do with the cartography. If you already have the MAX Pro charts, you do not need to pay for additional vector charts.
If you would like additional and expanded chart coverage, the FREE NOAA Raster Charts are available – and they come included in the VNS 11 or Admiral 11 box kits.
If a customer has VNS 9 or Admiral 9(or lower versions) which are still on Passport Charts, C-MAP offers a tremendous solution – which is to upgrade their vector charts from Passport to MAX Pro for 1/3rd the price of a Full Purchase of the charts. For a MAX Pro Wide area which retails for $339, the upgrade price for Passport customers is $105. A small price to pay for massively updated charts from out of date Passport charts from many years ago. And any prudent mariner should always have up-to-date charts on board.
That all being said, the C-MAP MAX Pro charts are far more than a collection of just the S57 chart from NOAA. C-MAP aggregates a vast amount of data from numerous sources and incorporates that data into MAX Pro. The price includes all the vector charts, high resolution bathymetric charts, 3D data, high resolution marina data (which is the basis of the original post from Ben, above), high resolution Satellite Imagery and Perspective Photos of harbors, marinas and approaches. And if that were not enough – MAX Pro has the unique capability to update ALL the vector charts with weekly Notice to Mariners and critical safety updates through their RTU / Quick Sync chart updating service, which Jeppesen / C-MAP keeps up to date on their web servers every week.
I do respect the points you make, there seems to be a lot of misinformation out on the market about Nobeltec. Let me know if I can help correct some of these misunderstandings.
Regards
-Bill Washburn
Nobeltec
Bill,
Kudos to Nobeltec for being so market focused. Not many companies are today.
So I must apologize… after all the complaints, I realized I already had C-MAP charts from my Max Pro upgrade. So no big deal in spite of all my complaints… sorry.
Here’s the best part though… I realized that as a member of US Power Squadron I’m eligible for a 25% discount (again, Kudos to you for this) so I upgraded to 11 today and upgraded the C-Map charts also
In the end I knew I’d do it because Nobeltec has the best features (in my opinion) of any of the programs out there… particularly the fact that I can feed my DSC output from the radio to the software and it will plot DSC position requests (and distress calls too I hope)
So all my data (DSC, AIS, etc) all feeds to a Brookhouse MUX and then to Nobeltec.
Again, thanks for the dialog, and the great software.
Dan