
Lithium battery lifespan part 2, a new battery checks in
The end of last year, I posted my first entry comparing the lifespan of a LiFePO4 battery to the claims made by the manufacturer. That entry relied on data from 525 cycles on the battery. Since then, I have continued my testing and added a second battery and testing rig to the mix. Let’s check in on the testing of both batteries and an interesting trend developing with the first battery as it crosses 1,000 cycles.
Currenlty, the original WattCycle 100ah battery I started with has 1,100 cycles on it. I have also added a Blue Heron 100 amp hour Extreme series battery to the testing. That battery now has 500 cycles on it. Both WattCycle and Blue Heron make pretty heady claims about the life of their batteries at 5,000 and 6,000 cycles respectively. Frankly, I’ve always been skeptical that batteries will last that long and my testing hasn’t done anything to tamp down that skepticism. However, I also don’t believe batteries need to achieve anywhere near the number of cycles they claim to provide practical usage and excellent value compared to their cost.
Current results
Capacity Retention vs. Cycle Count
Test current: 5.0 A · Rated capacity: 100 Ah · EOL defined at 80% SoH
As we look at the data so far there are two things that jump out at me. First, the WattCycle’s rate of capacity degredation has slowed dramatically. If you click the “Projected Lifespan (recent)” tab above, you can see how much the more life the recent tests indicate. Because that battery is the very first one I’ve cycled continuously, every piece of data I glean with it is new.
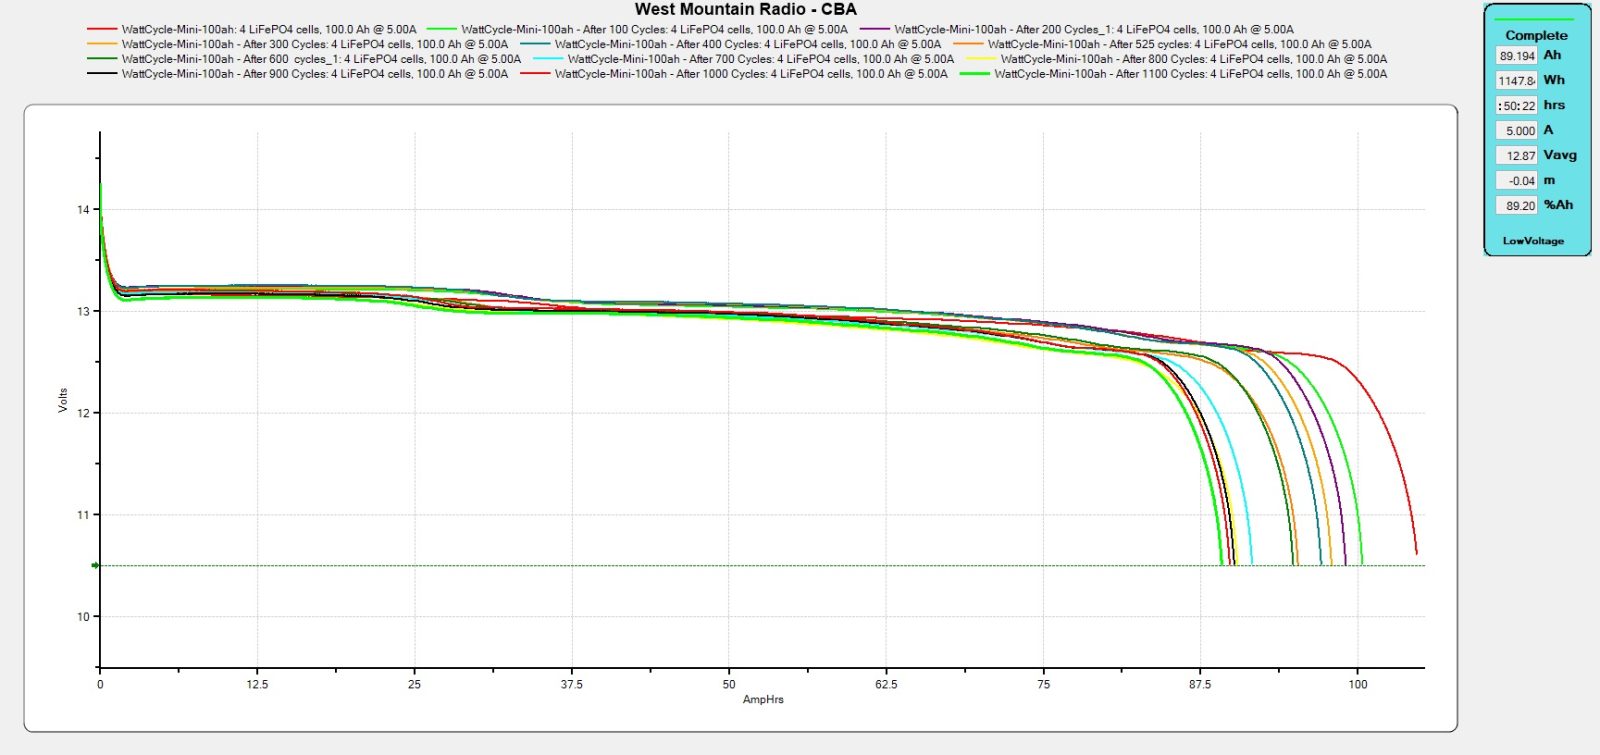
So, currently I’m trying to understand trends with a dataset of one which is dangerous. But, despite that danger, I am wondering if this is indicative of a behavior in which degradation is faster in the early portion of the battery’s life and slows over time. When comparing the degradation from the very first (over rated capacity) tests to the tests a few hundred cycles in, we see a pretty big drop.
The second thing I notice is that the Blue Heron data is quite volatile. I am very careful with my methodology in these tests and control external variables as much as possible. That includes discharging and charging the battery in the exact same manner throughout the tests. Additionally, the every 100 cycle capacity tests are performed in the same manner with the same West Mountain Radio CBA V tester each time.
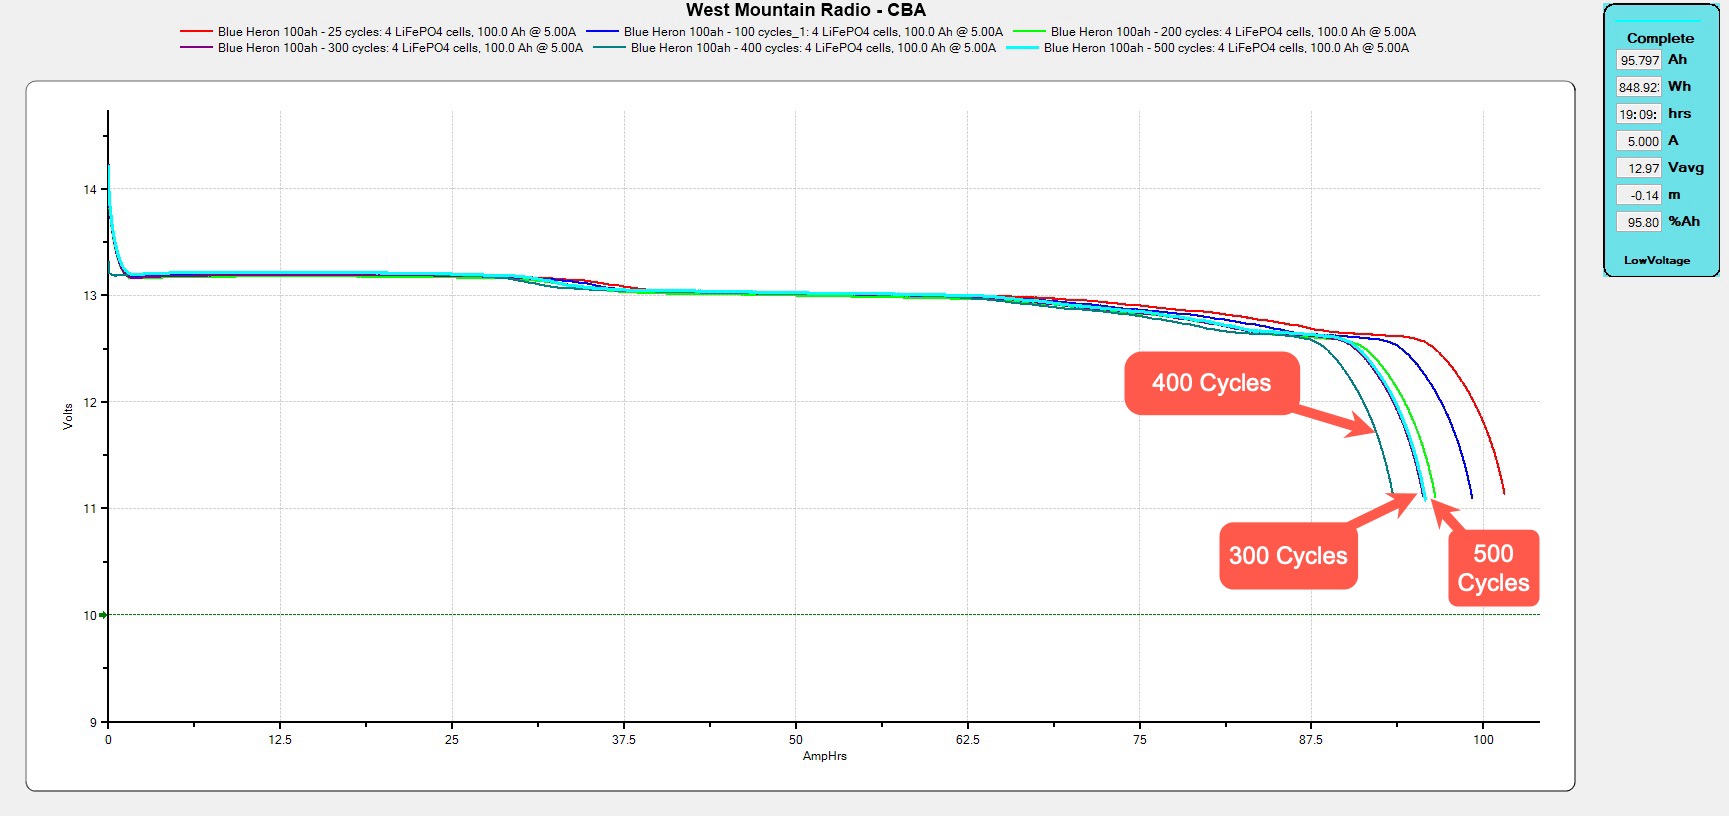
The test chart from West Mountain Radio’s CBA software confirms that the overall discharge pattern looks correct. It started at the same voltage, didn’t display any anomalies during the test and tapered with the same curve as the other tests. But, that test also showed less energy was stored in the cells that previous and subsequent tests. With confidence in the methodology, all I can do is report the results.
Cycle Test Results & Lifespan Projections
Projected-cycle columns estimate when each battery will reach 80% of original capacity (EOL).
Cumulative basis: uses total loss since cycle 1. Recent trend: uses the fade rate over the most recent interval only.
Values in color show gap vs. the manufacturer’s cycle claim (WattCycle 5,000, Blue Heron 6,000). All tests at 5.0 A discharge, 100 Ah rated.
| Battery ⇅ | Cycles ⇅ | Capacity (Ah) ⇅ | % lost ⇅ | Proj. life (cumulative) ⇅ | Proj. life (recent) ⇅ |
|---|
The table above breaks down projections of expected cycle life based both on all tests and the delta between each test. Note that there is no projection based on recent data for the Blue Heron at 500 cycles. That’s because of the increase in measured capacity observed between 400 and 500 cycles. That’s an unexpected result and I don’t see a way to make cycle projections based on it. Both batteries show quite a bit of volatility in their projections based on recent data. Perhaps that estimate isn’t as useful as I hoped. I’ll keep watching it and may drop it eventually if it proves low fidelity.
Understanding the actual cost of batteries
One of the reasons I undertook this testing is to understand some of the financial parameters of LiFePO4 compared to other battery chemistries. The most obvious comparison to draw is to lead acid. To support that comparison, I’ve begun cycle testing a Group 27 deep cycle battery. Lined up right behind that battery is a 6-volt, GC2 deep cycle battery. I hope to have something to report on the results of that testing in a month or two.The lead acid batteries will likely last many fewer cycles, capacity retention will fade faster, and overall they will store and return much less energy.
I expect the lead-acid testing will take significantly longer per cycle. LiFePO4 batteries both accept charge quickly and show minimal effects from relatively high discharge rates. The cycle testing I’m doing now both charges and discharges the batteries at 0.5C or half their capacity. So, each charge and discharge cycle takes a little about 5 hours including a 30 minute rest period. Lead acid can’t be discharged nearly as quickly without significant capacity impact.
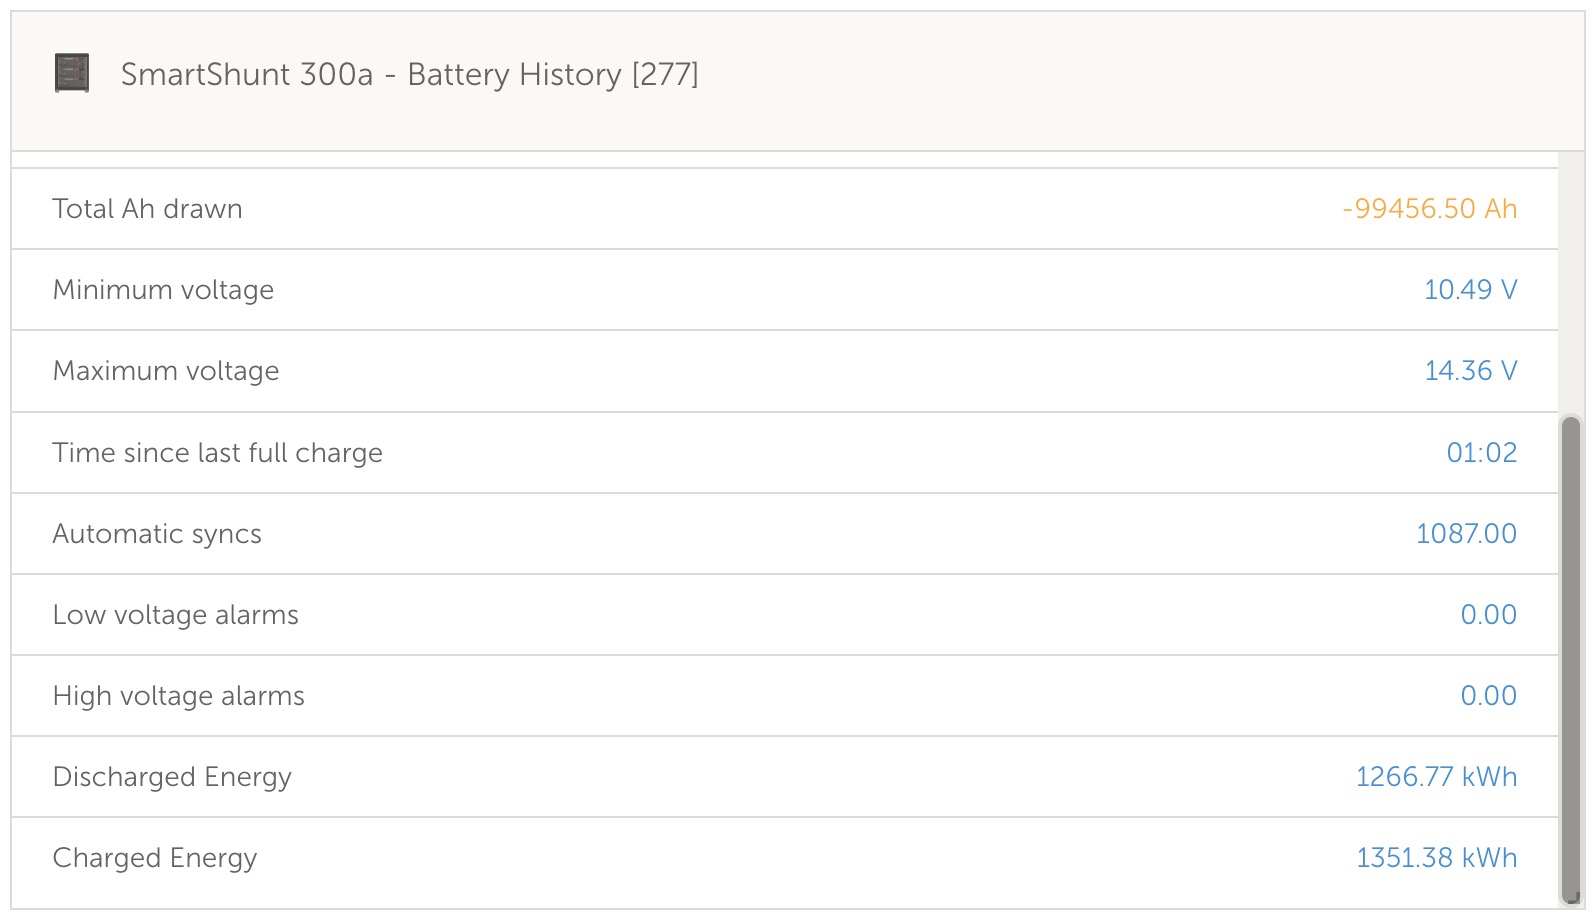
The VRM detail above shows what the SmartShunt sitting in front of the WattCycle has observed over the last 1,100 cycles. One interesting observation is that the total charge and discharge energy suggests the battery has been operating at 93.7-percent efficiency. That’s pretty impressive and another aspect in which I expect to see a big contrast with lead-acid.
Cost per kWh: Rated vs. Projected
| Battery ⇅ | Cost ⇅ | Ah/cycle⇅ | kWh/cycle⇅ | Rtd Cycs⇅ | Proj cycs⇅ | $/kWh (rated) ⇅ | $/kWh (proj) ⇅ |
|---|
Without performance results from lead acid testing, we have some holes to fill in. But, we can start to get a picture of the cost of energy as stored and delivered by a battery. There are quite a few energy efficiency benefits to LiFePO4 owing to the chemistry’s fast acceptance of charging and high efficiency in accepting that charge without turning much into heat. But, for the sake of these comparisons, I’m not going to worry about those benefits. We are just going to look at how much energy a battery delivers versus the cost of the battery.
As we look at the cost per kilowatt hour, I want to mention that this metric ignores nearly all other aspects of these batteries. For example, the Watt Cycle 100ah Mini is as stripped down of a LiFePO4 battery as you will find. It has no Bluetooth communications, no Victron Communications, no heating, and supports significantly lower limits than the Blue Heron battery. This comparison focuses only on the ability of the batteries to store and deliver energy. While that is a battery’s primary purpose, modern, high performance electrical systems often utilize significant other features worth considering.
What jumps out at me about this comparison is how much more costly each kilowatt hour of energy is when delivered by a lead-acid battery. The very short cycle (and typically calendar) life of a lead-acid battery means that every cycle and every kilowatt hour of energy comes at a much greater cost. Let’s first compare ratings where we see that even an inexpensive lead acid battery delivers energy at more than 16 times the cost of the WattCycle battery and more than 4 times the cost of the Blue Heron. We don’t have enough lead acid data yet to fill in any sort of projection, but we do see that comparing the cost per kWh is not favorable for lead-acid. That’s not surprise since the expected cycle life is so much shorter.
Figuring out what this all means
I have done a lot of testing on LiFePO4 batteries recently. Some of that testing has been in support of some consulting that I’m doing and I’m still figuring out how to write all of that up. But, the theme of nearly all the testing I’ve done is the degree to which the cells determine the performance of the battery. That might sound obvious, but, when we compare lithium-ion batteries to lead-acid, the big difference is the presence of the BMS. So, there has been a lot of focus on the BMS. I think that focus was emphasized with some early batteries with BMS design or reliability shortcomings. However, the testing I’m doing now suggests even relatively low-end BMSs are very solid and not likely to be a source of issues.
What has become very clear is that in proper operation, the BMS fades into the background and the performance of the battery really comes down to the performance of the cells. A BMS performs two functions and if all goes well, only one is active under normal operations. The first function the BMS performs is to act as a gatekeeper and safety device. It will shut things down if voltages, temperatures, or currents get too high or (for voltages and temperatures) too low. A properly installed and functioning battery shouldn’t hit any of those values. The second thing a BMS does is ensure the cells stay balanced. There are a few ways they accomplish that, and that’s a topic for another day.
Many of the ratings we see on the side of the batteries we buy come directly from the cell manufacturer. If a cell manufacturer rates their battery for 5,000 cycles, that’s what the battery manufacturer will put on the spec sheet. If the cell manufacturer says the battery can handle 1C continuously, the battery manufacturer will size the BMS appropriately (hopefully) and put that spec on the sheet too. But, like so many specs, many of those ratings are based on laboratory conditions. In the real world, the cells might not be held under the same compression or subject to the same temperature. So, our actual specs are likely to lag those on the sheet.
For the vast majority of boaters, 3,000 cycles is a sublime lifespan for batteries. It is generally acknowledged that LiFePO4 batteries should last a minimum of 10 years. At 3,000 cycles and 10-years, that is 300 cycles per year. The test cycles I’ve subjected the batteries to have been to 90-percent depth of discharge, which I believe exceeds typical use on a boat.
With a sample size of two batteries, I’m not ready to draw too many conclusions. But, I do find it very interesting that the less expensive battery is performing as well or better than the more expensive one. This cycle testing stresses the cells far more than the BMS and electronic components. So, perhaps WattCycle’s cells in this battery carry a little bit longer than those Blue Heron is using.
The only way to draw better conclusions is more testing. So, that’s just what I plan to do. I’ll start with the lead-acid testing but will also add additional LiFePO4 batteries to the mix.
P.S.
I’m using some new visualizations on this article with both the charts and tables. I’d love to hear any feedback on how easy they are to understand and what can be improved. Thanks! Ben S.


Thanks for making these comparisons. Will you also perform equalization regularly when you test the lead acid batteries? Dirk
I am planning to perform an equalization after the first measurable decrease in capacity. Once that equalization is complete, I’ll do another capacity test. It will be interesting to see if the equalization recovers meaningful capacity. I’ll probably repeat that test for a while. However, if post equalization shows no or very limited recovery, I will also likely stop the equalizations at some point.
There are so many variables to all of this testing that the best I can hope for is some representative samples. So far, the main thing that I’m seeing is that lead-acid testing is sooooo much slower than LiFePO4. Charge cycles take much longer, discharge is much slower, etc.
-Ben S.
Ben: This is exemplary work! Bravo Zulu!
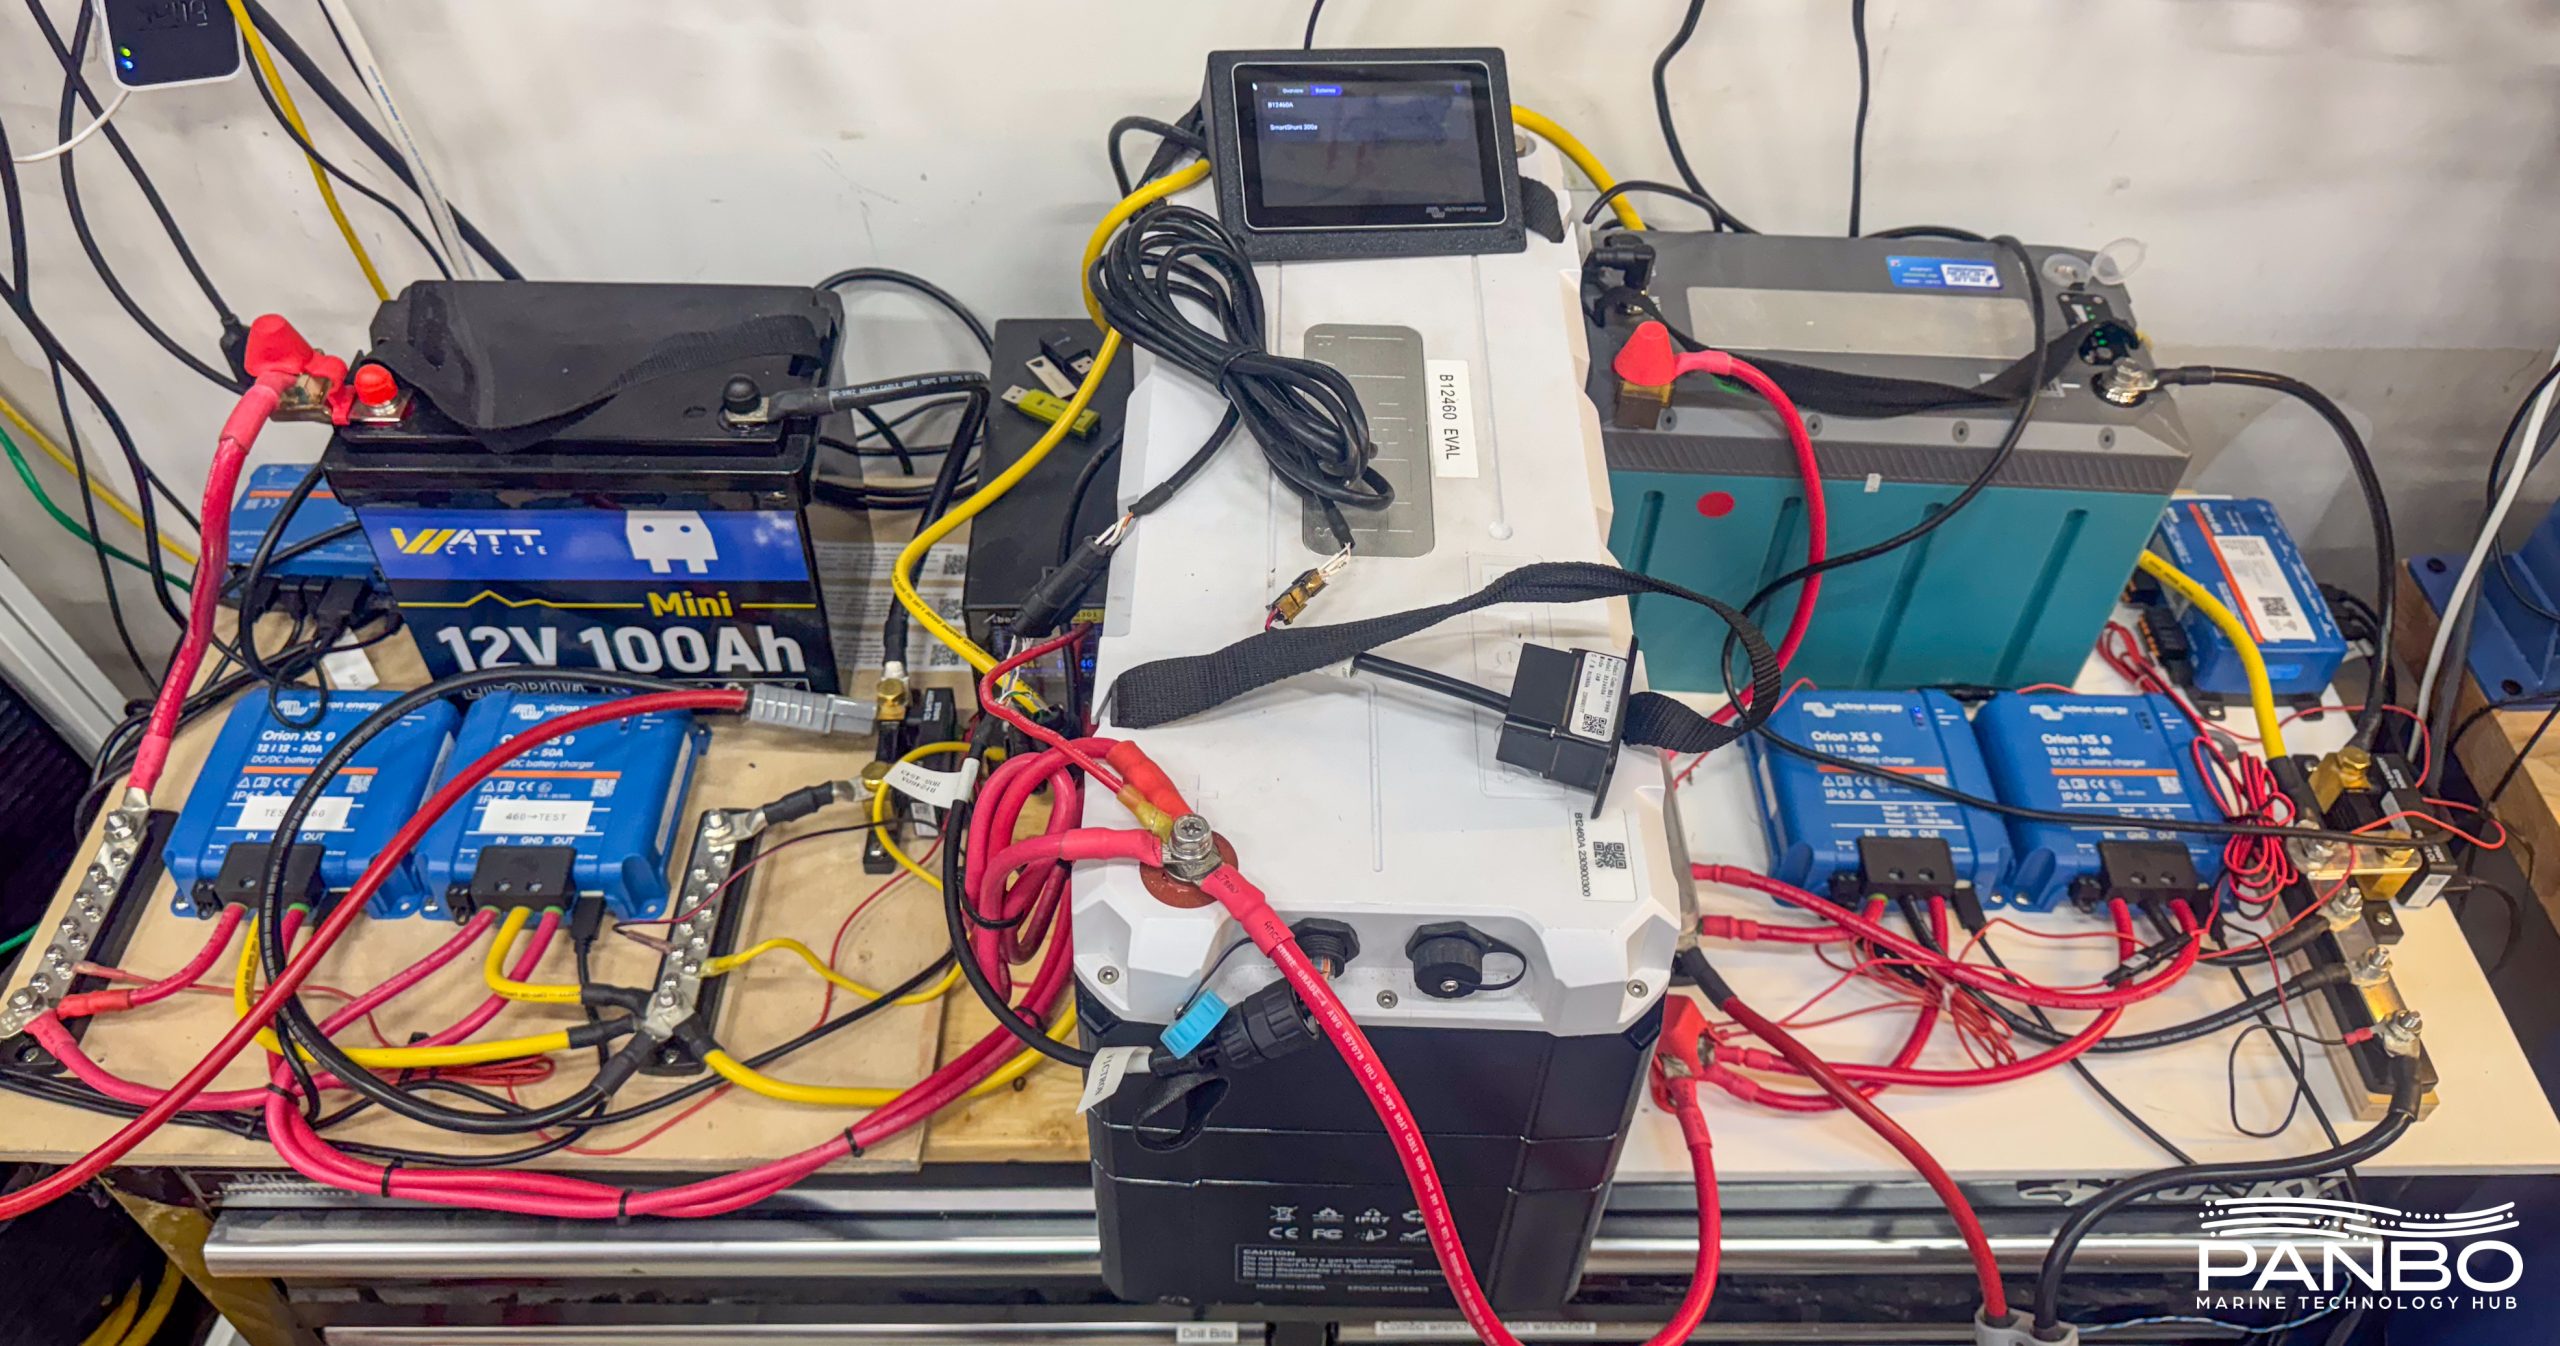
However, your wire management skills need some work.
And, your use of the “new visualizations” is great.
Great job Ben. I must say size and weight are also factors in a boat to be considered! Also how about factors for cars. In a car that is used regularly, with minimal discharge rates, which batteries wouold perform best!
Thank you for this very useful testing Ben.
Even with the drop in capacity over repeated cycles, (noting as well that unlike lead acid (LA) most of the LFP battery capacity is usable) your point around the efficiency of LFP is worth emphasizing. Being able to recharge quickly with sustained charge rates has many downstream advantages: shorter generator runs, less noise, wear & tear, better solar efficiency etc.
There are many extra costs to the inefficiency of LA.
Even with the potential loss of 10-15% capacity, I don’t know anyone who having switched their house bank to LFP would willingly go back to Lead Acid.
Outstanding!
Fascinating testing Ben, and intriguingly non-intuitive bumps in the results.
Personally I consider costs relating to energy efficiency highly pertinent, particularly if primary charging is coming from engines or generators, given the elevated fuel prices. The decreased time to recharge can result in shortened engine/genset runtimes, plus the greater energy efficiency results in reduced fuel burn. Our fuel burn with a small motorsailer (3YM Yanmar) has dropped by 20% since changing to Lithium batteries ~4 years ago.
I have yet to come across anyone regularly completing more than one cycle per day, and most leisure installations do substantially less. One cycle per day is pushing towards the 10 year mark based on manufacturer’s quoted cycles for quality cells, and given that most Lithium conversions tend to over-spec the battery capacity, even if the bank has reduced capacity it’s probably still capable of successfully powering the installation as it degrades. Consequently the calendar ageing interests me. I’m currently experimenting with a storage mode with our RV where the Victron solar reg has been pegged back to keep the battery around 60% full when the van isn’t in use. otherwise the regulator charges the battery to 100% each day.
Anecdotally temperature is said to have significant impact on degradation in addition to cell performance. Longevity should be far better as you move away from the equator.
Thanks again for all your hard work. New presentation of results works for me!
Interesting test, I will be following the results. Just for giggles I compared my 460AH Epoch V1 at 111 cycles, which came in at 98.7% but the original condition was nowhere near 105%.
It remains to be seen whether in real life these very expensive batteries are cost-effective to people who buy them and do not own their boat for 10+ years. Certainly they have a great benefit for installations in which the weight savings and power density are advantageous. For example, in a light flats boat with a 36V trolling motor, being able to achieve long run times without lots of weight is very beneficial. I can also see the advantages for cruising sailors who might spend a lot of time on the hook with no charging current available being able to have much more storage with the weight and bulk of a bank of 8Ds.
My two Lifeline AGM group 27 deep cycle house batteries are still doing their job after nine years in service. They have definitely lost some capacity over that time but it really makes no difference to me on a day-to-day basis because I almost never run the house loads without one or both motors or the generator running. At my slip or in winter storage, the charger is running. I doubt the batteries have been below 50% capacity more than a handful of times.
Would I have been better off in any way spending three times as much for LiFePo4 batteries? Not likely.
Horses for courses; but some of us greatly prefer to keep our generator runs to a minimum and value the efficient charge acceptance and lack of voltage sag that LFP offers.
There is No way I would elect to go back to lead acid for the house bank. I know many other boat owners who feel the same way and cannot think of any that would willingly go back to lead acid.
In addition, they are ultimately very cost-effective.
Totally agree Evan,
Additionally Fred, I still think there’s a big perception vs reality divide on pricing for these batteries. Bear in mind that the battery that has now done 1,100+ cycles costs $189.99 (https://www.wattcycle.com/products/wattcycle-12v-100ah-mini-lifepo4-battery) for a 100ah battery. A lifeline Group 27 battery costs $504.99 (https://defender.com/en_us/lifeline-agm-deep-cycle-marine-battery-gpl-27t) and is also rated at 100ah. But, at 50% useable energy, it effectively stores a little more than half the usable energy of a LiFePO4 battery that easily can go to 80 or 90% depth-of-discharge. So, the Lifeline costs $10.10 per usable amp-hour whereas the ultra cheap LiFeP04 battery costs $2.37 per usable amp hour at 80% DoD. The significantly more expensive Blue Heron is a hair cheaper than the Lifeline at $9.86 per usable amp-hour at 80% DoD. However, go to something like an Epoch Elite 12v, 460ah V2-T and the cost per usable amp hour comes down to $5.97. Between lasting for dramatically more cycles, being lighter, and cheaper, I’m fully sold.
I recognize there are other considerations with a move to LiFePO4 and not every circumstance will demand the move or see the return. I agree that in your case Fred, I wouldn’t make the move proactively. On the other hand, when those AGMs give up the ghost, I’d have a hard time paying more for less by replacing them with the same configuration.
-Ben S.
My perception is probably distorted because the Lifeline batteries only cost about $250 back in the good old days when they were installed. Today the LiFePO4s are very cost competitive. When my AGMs do give out, the cost analysis would need to include working around the necessary changes to the charging system especially if I have a mixed configuration with the current AGM starting batteries (which are only two years old, not having lasted as long as the house bank) for the two Diesel engines.
I am hardly an expert but it does seem that my current system using a Blue Sea Systems 40A P12 three bank charger would not be work with LiFePO4s in place of the AGM house bank.
Great job doing all this testing and analysis by the way.
Fred,
Indeed, the last time you bought house batteries there was no contest about value leadership. AGMs cost half what they do today and LiFePO4 probably cost 3-5 times what they do today.
My quick interpretation of your circumstance is that you are right on the bubble of economically justifying a LiFePO4 conversion. I would introduce a single Victron IP43 charger for shore charging and an Orion XS 1400s to charge from engine start to house. The IP43 would be about $400 and the Orion about $350. So, to do the cost analysis accurately, you would have about $750 in conversion expenses plus the battery. You have a house system on the smaller side so the conversion expenses hit harder. But, I would imagine that you would be a few dollars more to convert to LiFePO4 than replace with like. However, I would expect the battery life would be longer and any subsequent replacements far cheaper.
-Ben S.