
Testing LiFePO4 cycle ratings, are they accurate?
One of the biggest advantages of lithium iron phosphate (LiFePO4 or LFP) batteries is their cycle life. A LiFePO4 battery is likely to last thousands of cycles compared to hundreds of cycles for most lead-acid chemistries. While shopping for batteries, you are likely to see cycle ratings ranging from 2,000 to more than 6,000 cycles. Traditional wisdom also holds that LiFePO4 batteries last ten years or longer. Based on the way batteries are cycled on boats, it is relatively unlikely batteries will ever see 2,000 cycles in ten years, let alone 6,000. So, you may not make a purchasing decision based on cycle ratings, but, they indicate the quality of the cells in the battery and how the battery will perform over its lifespan. So, armed with an understanding of what cycle ratings mean, I set out to measure the life and capacity of a battery over many cycles.
The test
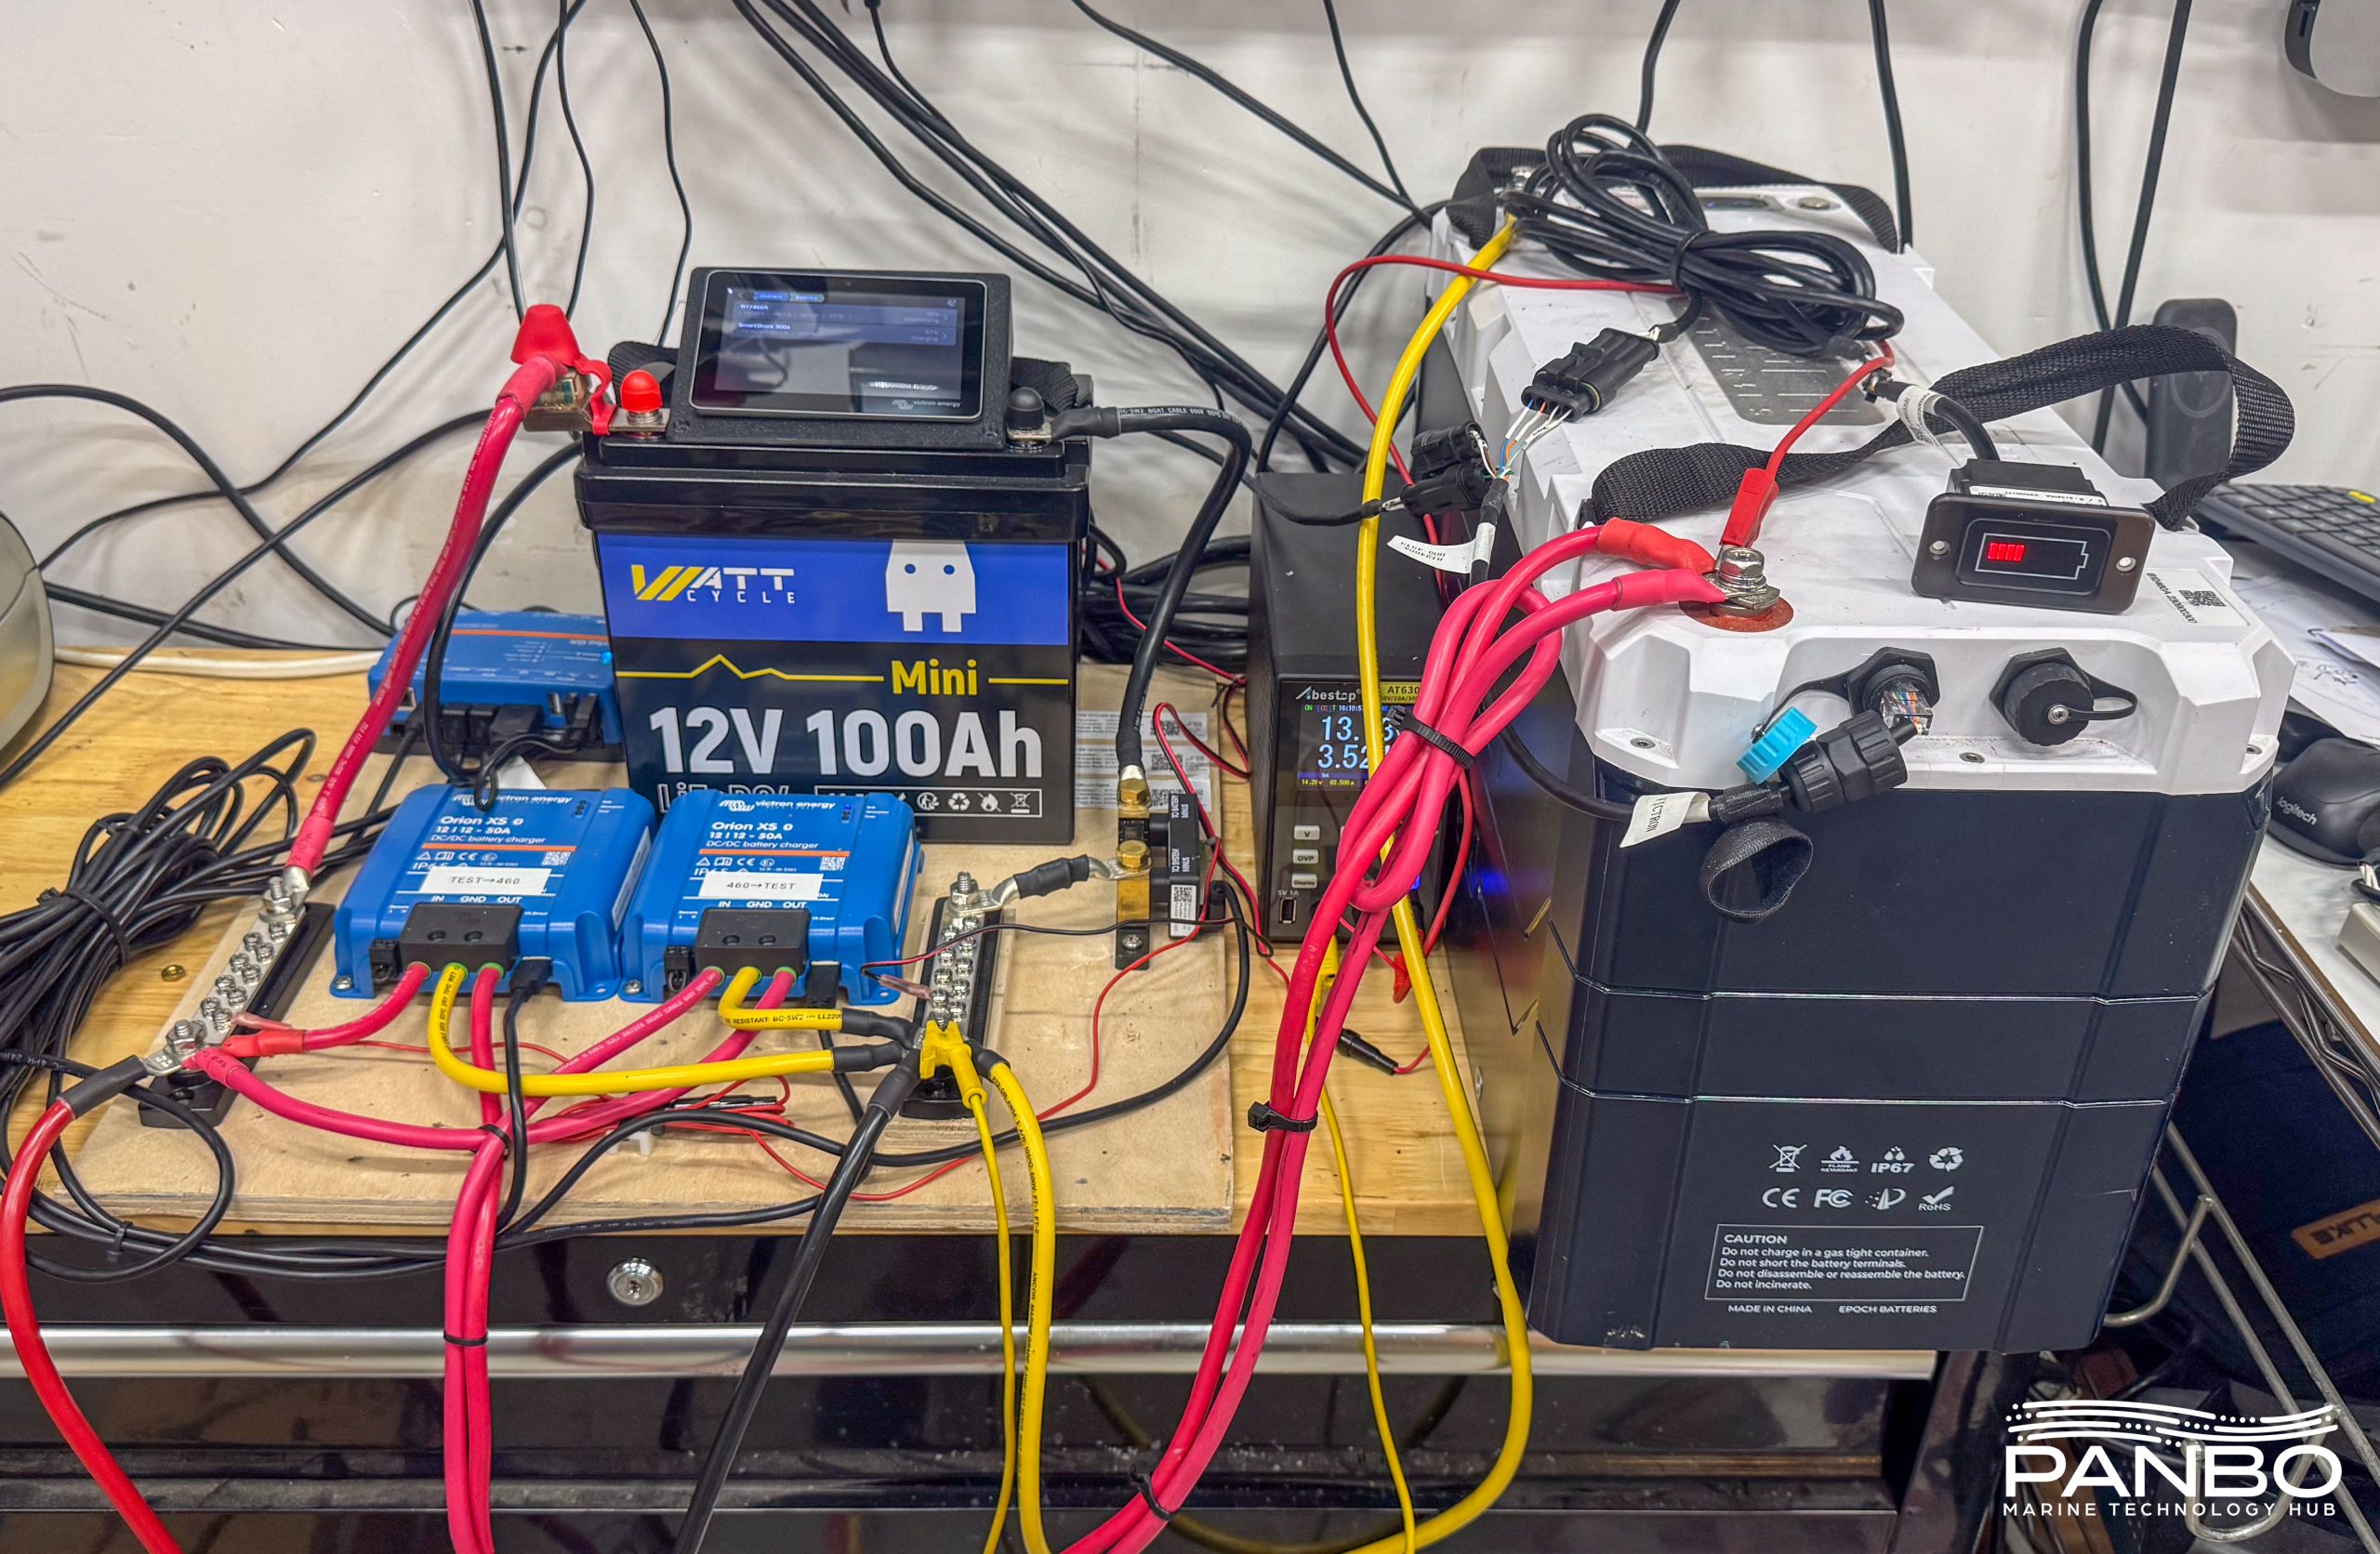
To test hundreds or thousands of cycles, I needed an automated setup to do the testing. At first, I used a couple of relays along with some load testers and a battery charger with PC based automation to control it all. That worked, but each cycle involved turning over a kilowatt hour of power into heat. That seemed silly, especially as I do this testing in my air conditioned shop. So, not only was I wasting a kilowatt hour of electricity with each cycle, I was also turning that electricity into heat that I then had to use air conditioning to reject. That cycle caused me to evolve to using Victron Orion XSs connected to a much larger, 460 amp-hour, battery.
My test setup reads like a nice chunk of Victron’s catalog. I am using two Orion XSs, one sending energy from the 460ah energy storage battery to the test battery and the other sending energy the opposite direction. I am using a 300 amp SmartShunt to measure energy in and out of the test battery. Finally, a Cerbo GX monitors and controls everything. Node Red running on the Cerbo itself provides the automation I need to cycle the test battery repeatedly. Node-Red, the Node-Red dashboard and SignalK Server are all part of the Victron Venus OS large image. Installing those features is as simple as changing the image type on a Venus device’s — like the Cerbo GX — firmware menu.
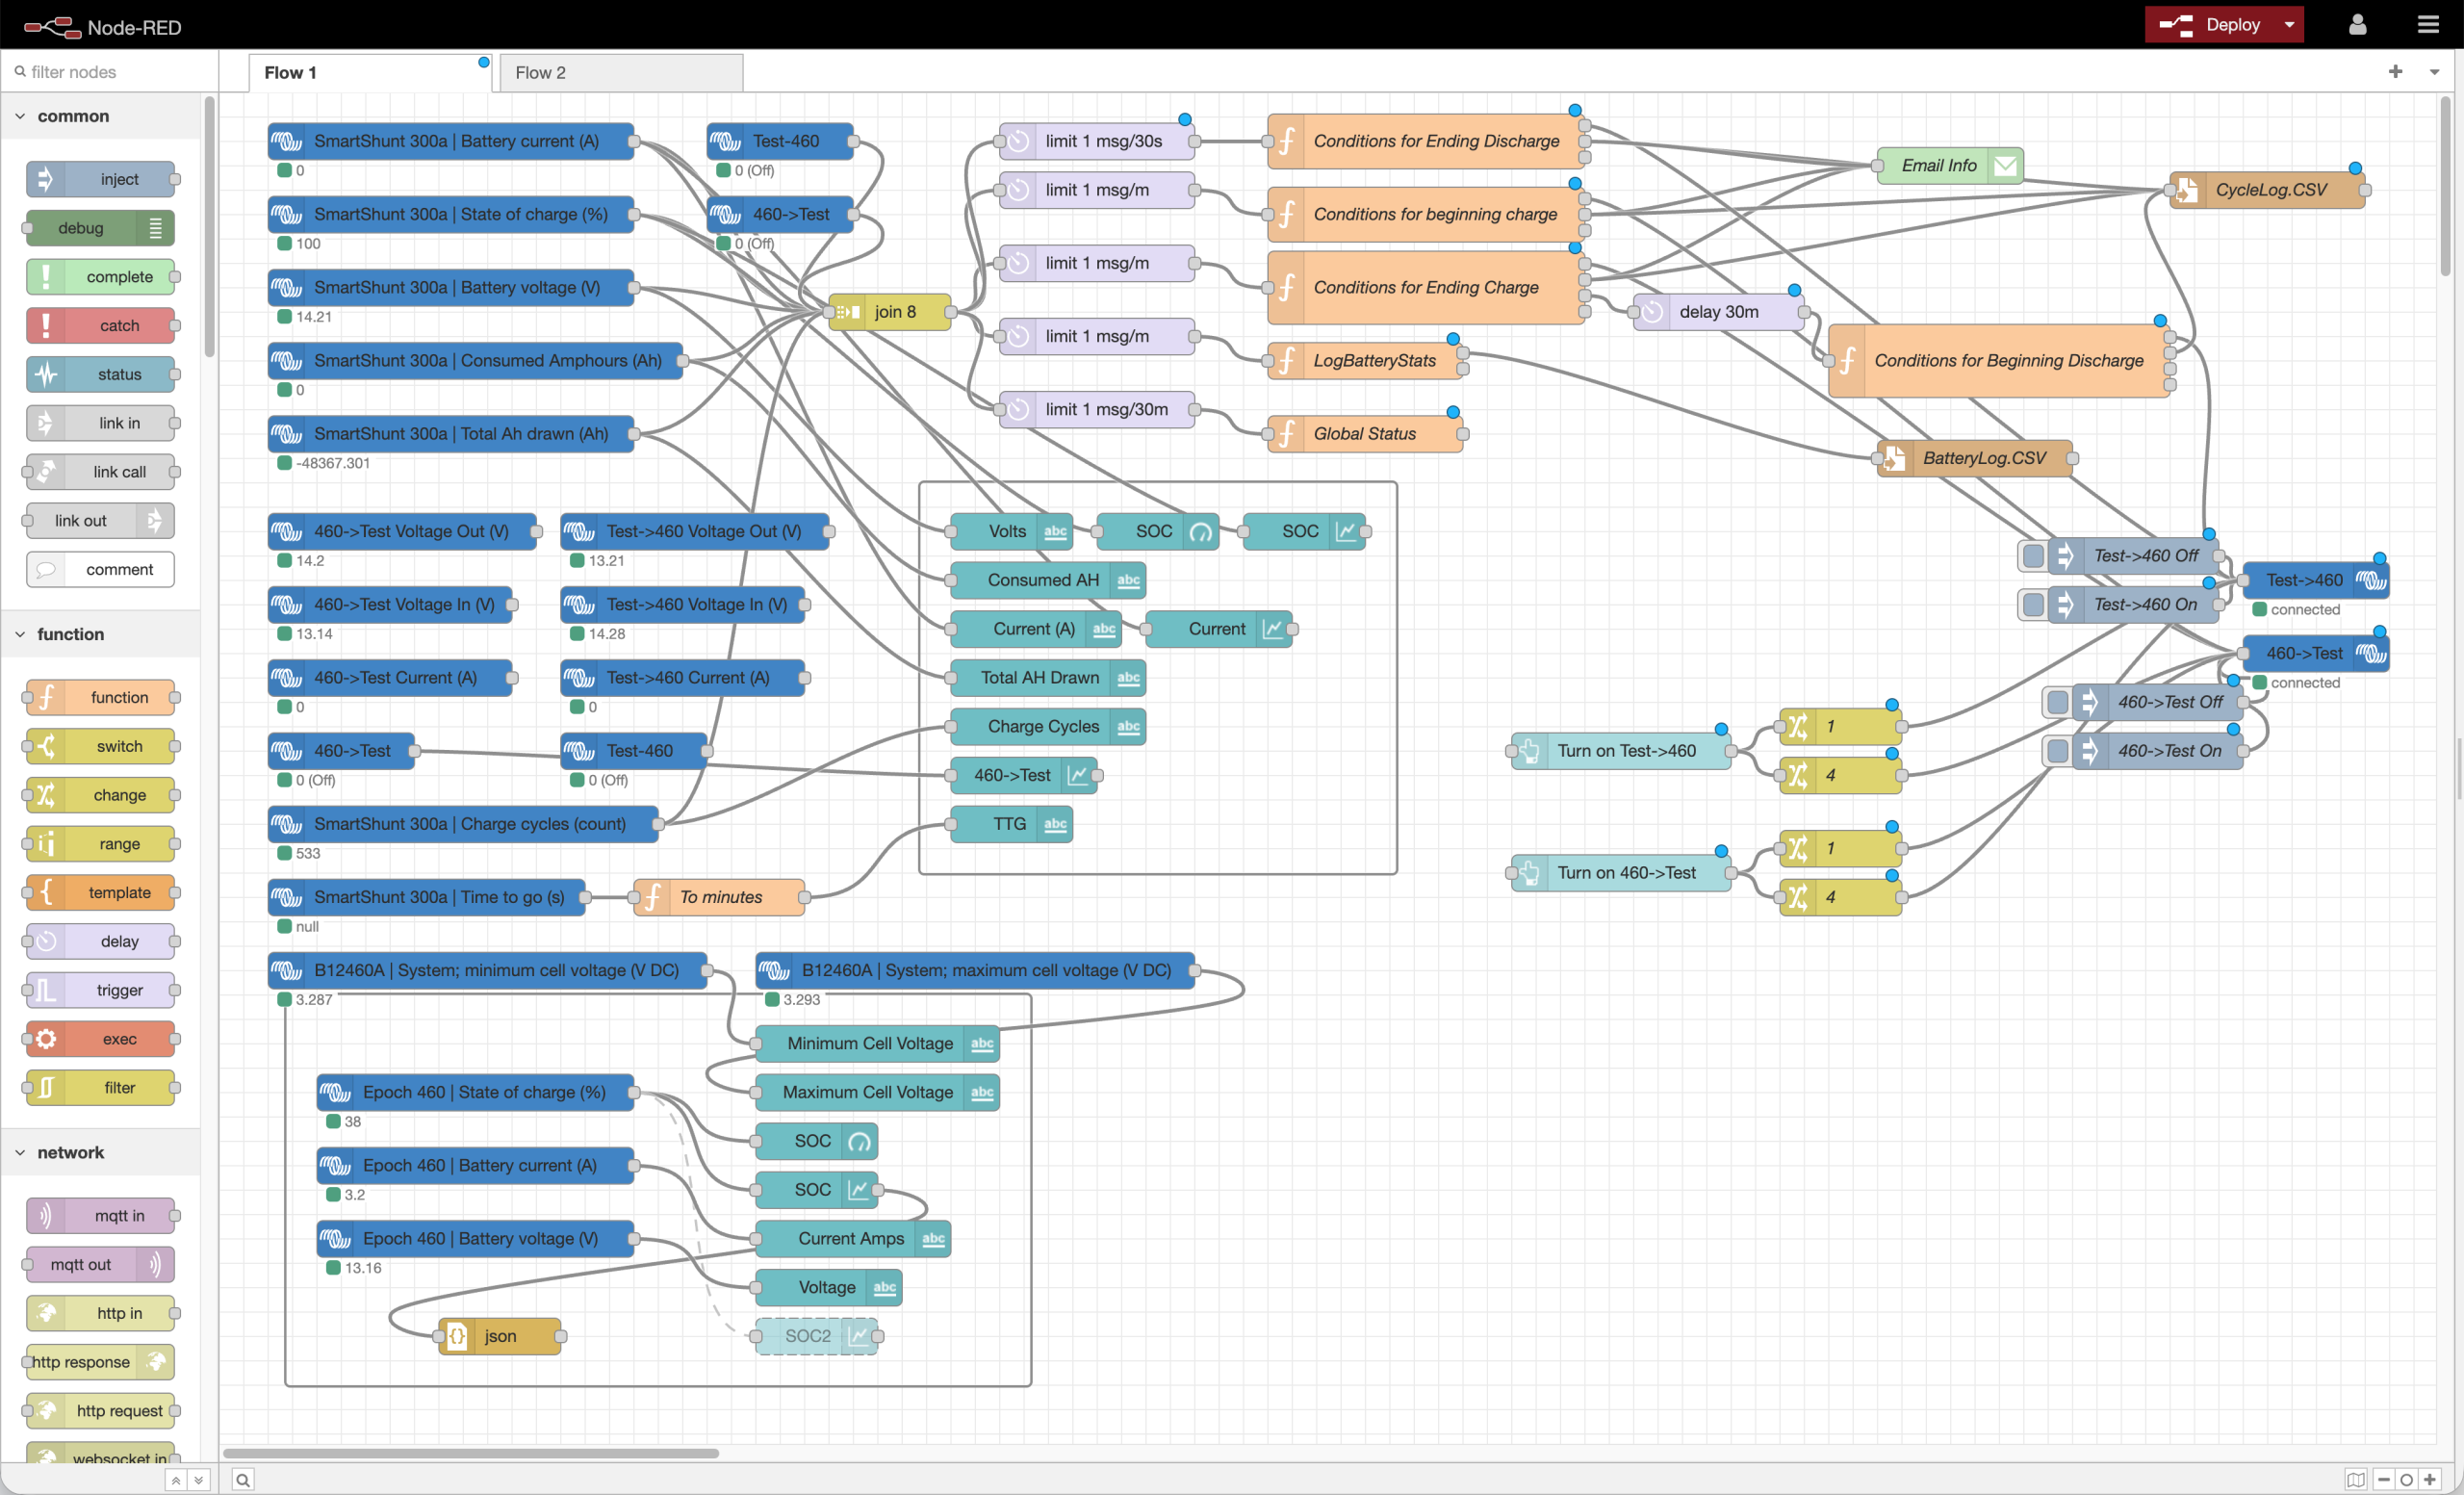
The screen above shows the Node-Red flow that both automates the test and populates a dashboard I can use to monitor testing. Before I get too far into the logic, let’s look at the parameters I used to define and manage a cycle
Test parameters
I have consulted numerous standards bodies and industry coalitions looking for standardized definitions of a battery cycle. Effectively, not much is standardized. As a result, battery manufacturers have a lot of leeway to determine testing methodology and ratings. Fundamentally, Battery Council International (BCI) defines a cycle as one discharge followed by one recharge of the battery. Ok, that’s pretty straightforward. However, there isn’t similarly clear guidance on specific parameters. For my testing, I identified depth of discharge (DoD), charge and discharge rates, and end of life performance as the most important parameters.
Research about how others have tested lead me to the following decisions:
- Depth of discharge will be 90% per discharge cycle
- Discharge and charge will both occur at 0.5c or half of rated capacity
- The battery will be charged with a fixed voltage of 14.2 volts
- Charge completion is determined when charge current is below 0.2 amps and SOC is measured in excess of 99-percent
- At charge completion, disconnect all loads and charge sources and the battery rests for 30 minutes
- End of life will be determined when the battery’s capacity tests fall below 80-percent of its rated capacity
Test procedure
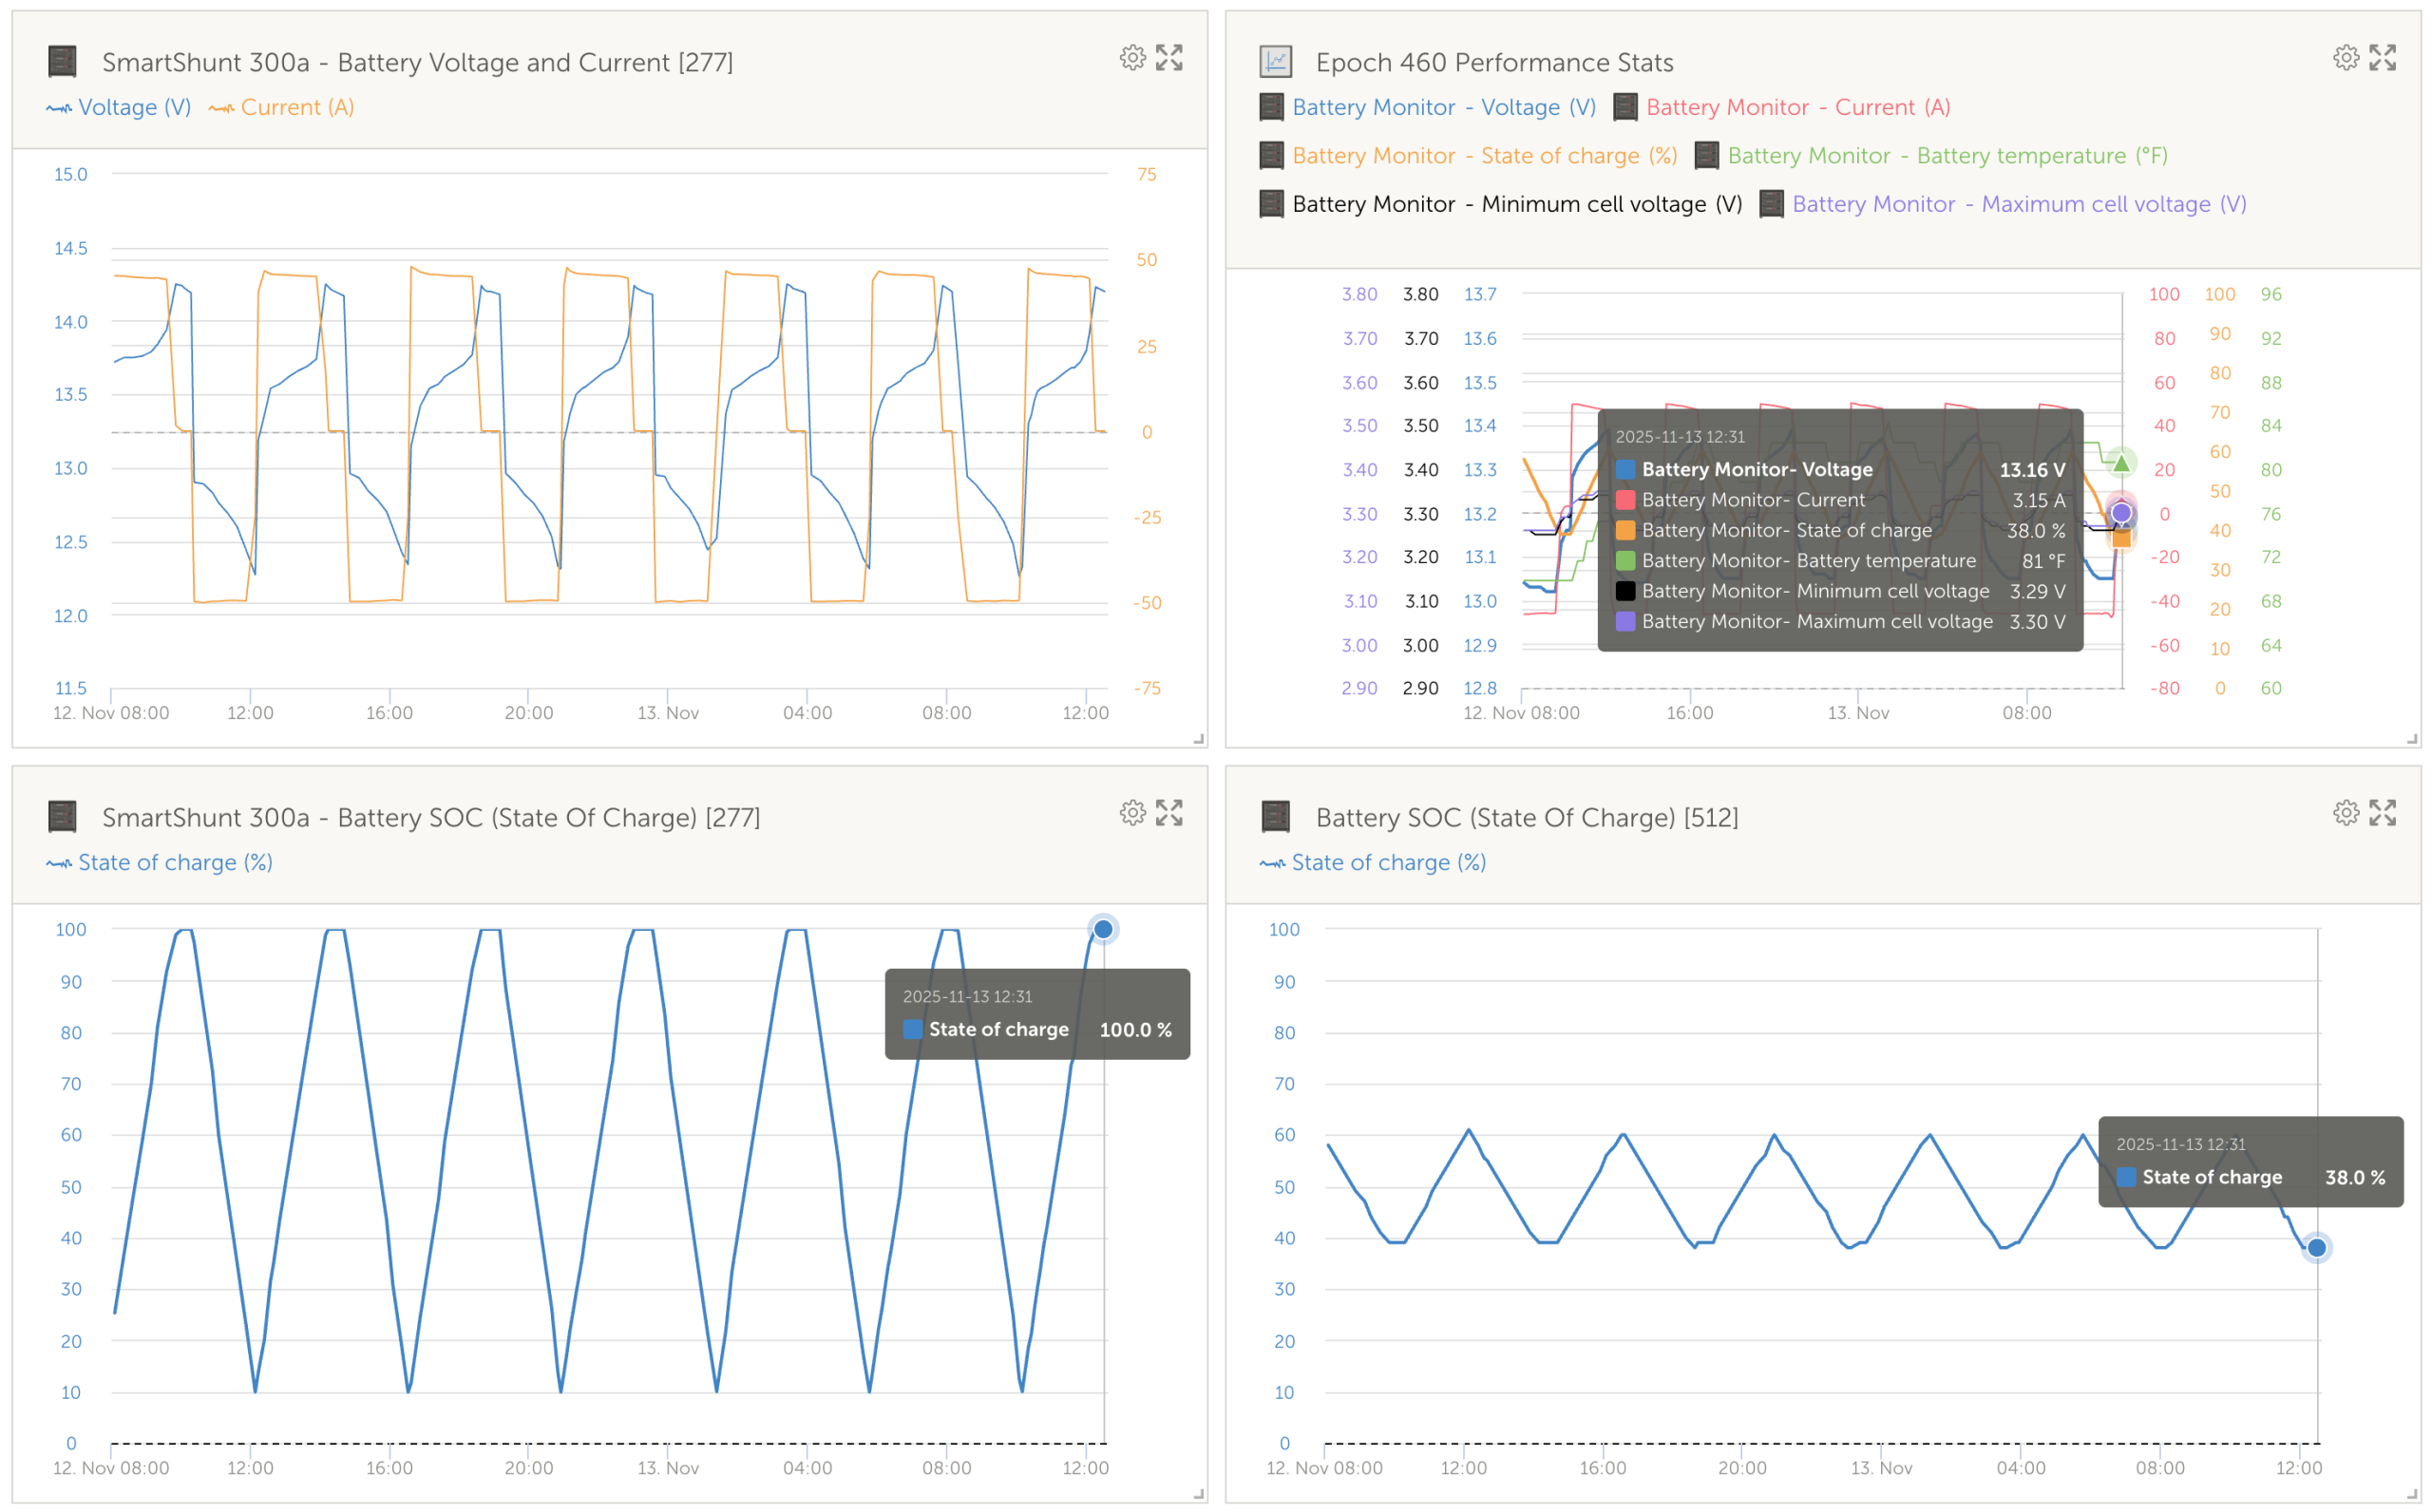
Testing starts with a full charge cycle from the 460ah storage battery to the test battery at 0.5c. Charging continues until SOC is above 99-percent and charge acceptance is below 0.2 amps. Once the battery is charged, the battery rests for 30 minutes. At the conclusion of the rest period, a 0.5c load activates and sends that energy to the storage battery. That continues until SOC on the test battery reaches 10-percent, as indicated by the SmartShunt. Once the test battery falls below 10-percent SOC, Node-Red turns off the discharge Orion and turns on the charging (460->test) Orion.
The cycle repeats until 100 additional cycles complete. At each 100 cycles — except for 500 where I screwed up the trigger — I complete a full discharge test. Full cycle tests start with a charge to 100 percent SOC and wait until charge acceptance is below 0.10 amps for at least 60 minutes. The test then runs at the 20 hour rate until the battery reaches 10.5 volts. Testing each 100 cycles establishes capacity along the way.
Each cycle takes just over four and a half hours to complete. So, the system completes a little over 5 full test cycles a day. That means, every 20 days I hit another 100 tests and run the full capacity test. So, getting to the full 2,000 – 6,000 cycle ratings of many batteries will take a long time, somewhere between 120 and 360 days.
Much of my testing was completed over the summer months when it can get very warm in Southwest Florida. My shop is air conditioned and the ambient temperature is kept below 84 degrees 24 hours a day with daytime temps typically lower. So, although not controlled to laboratory precision, I don’t believe temperature played a major role in the testing.
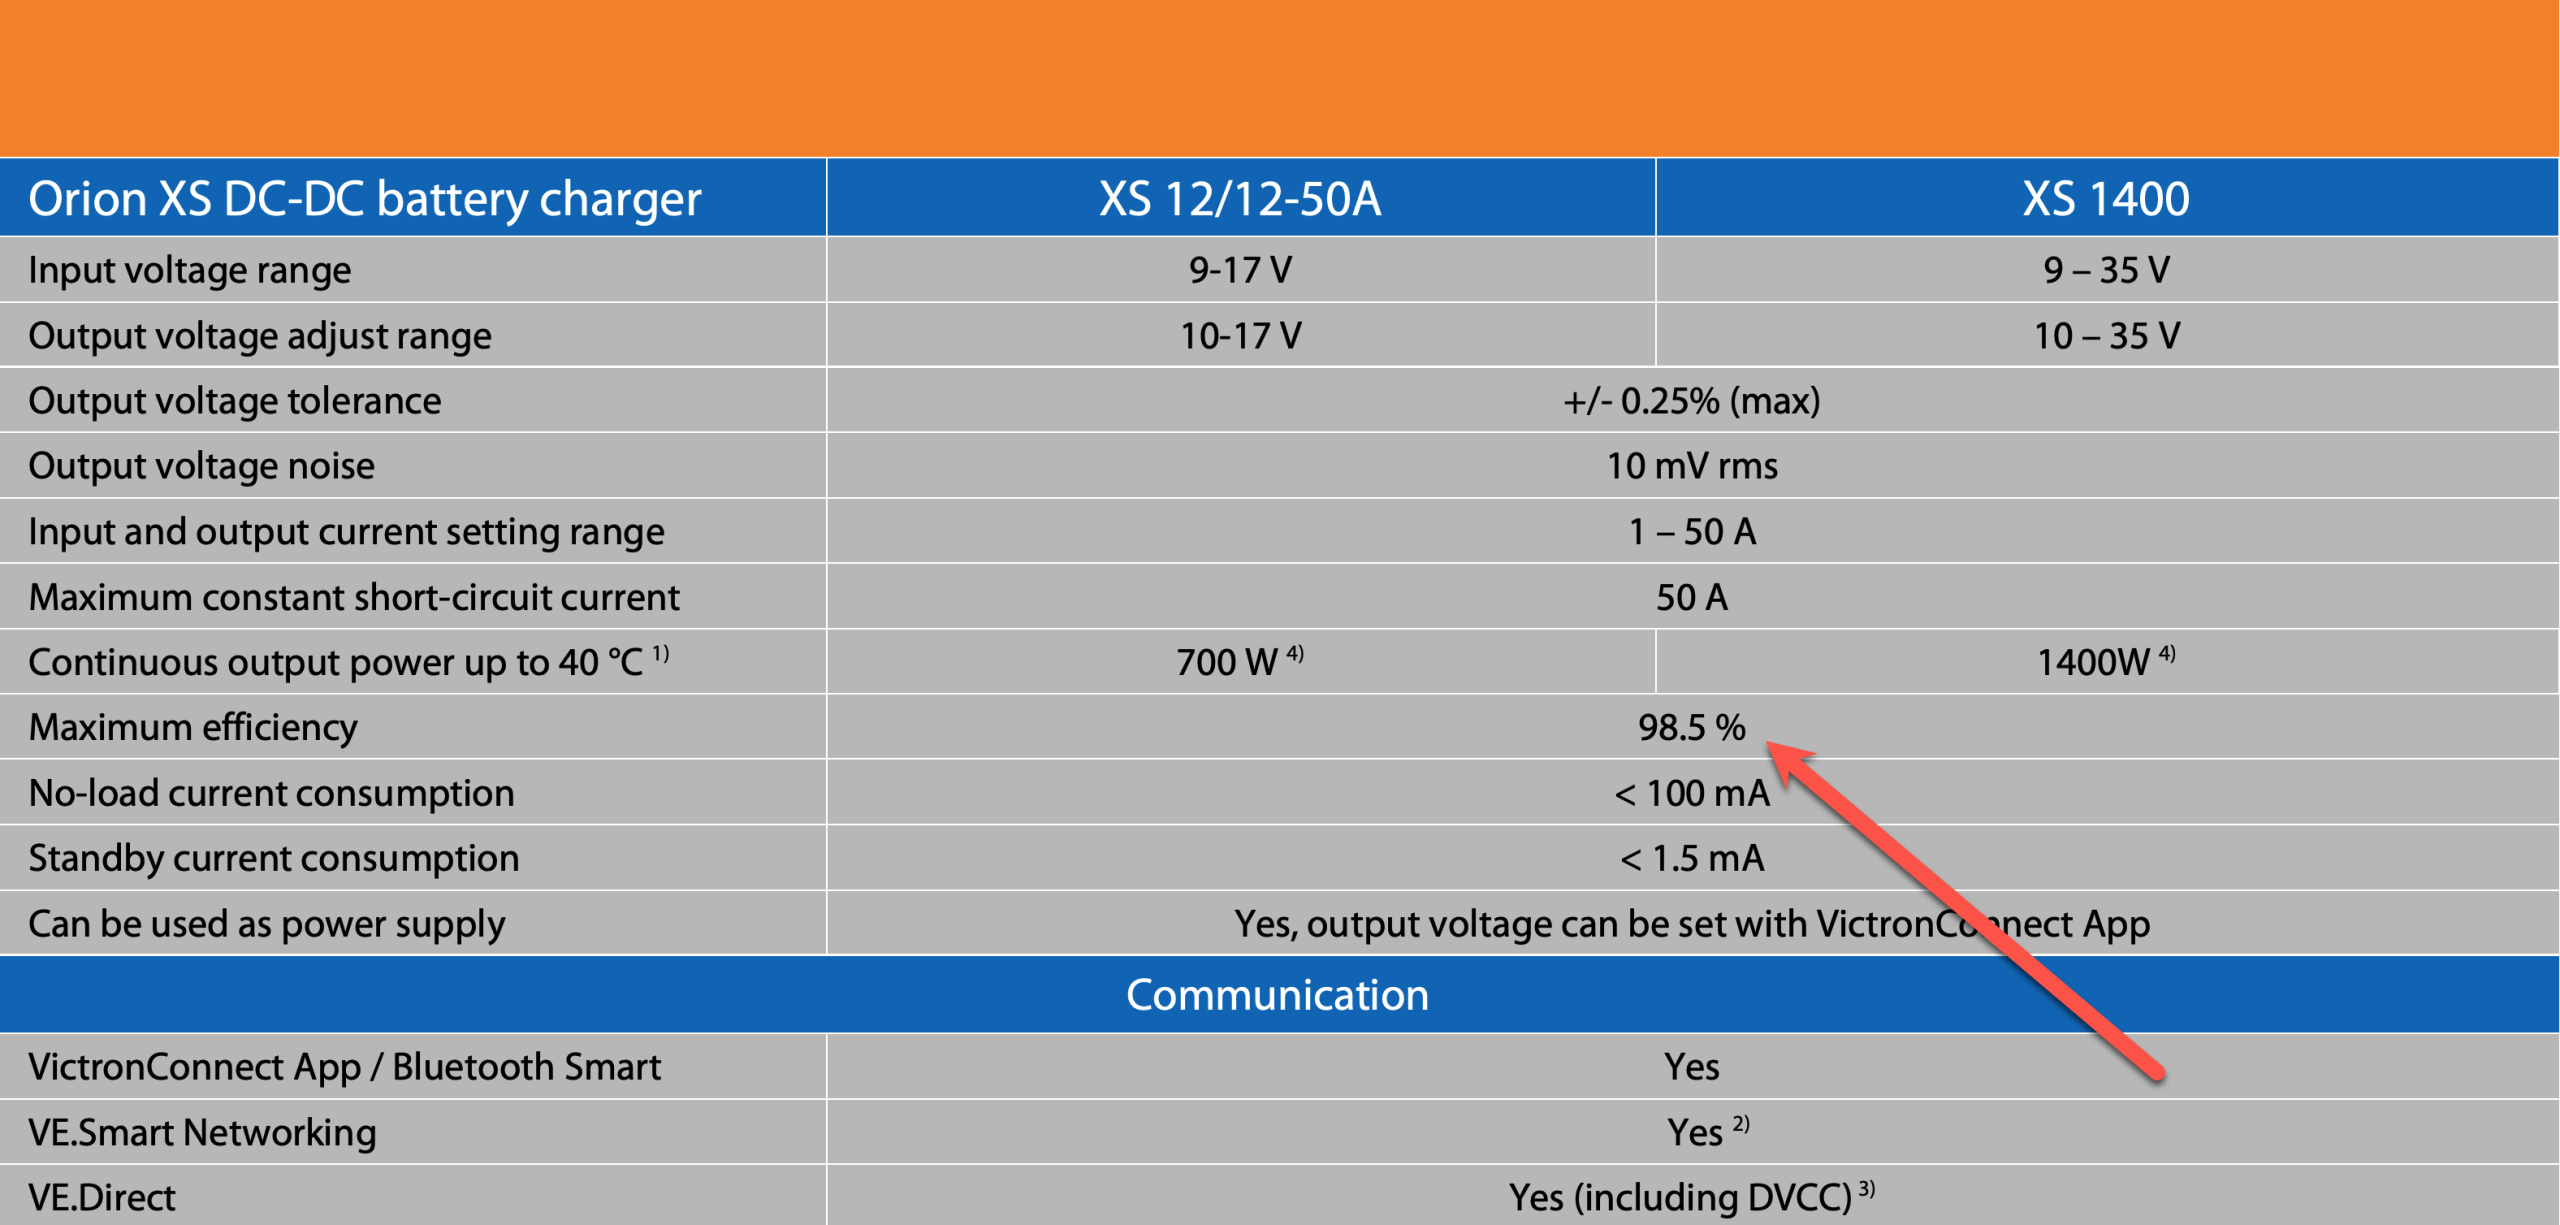
You may have noticed a DC bench power supply in the photo of the test setup. Victron rates Orion XSs as up to 98.5-percent efficient. Additionally, I am powering the Cerbo from the 460ah battery. So, to make up for the energy lost to heat, conversion, and monitoring, I am pumping in a steady 3.4 amps of current. That seems to keep the storage battery’s SOC in a comfortable range.
Results
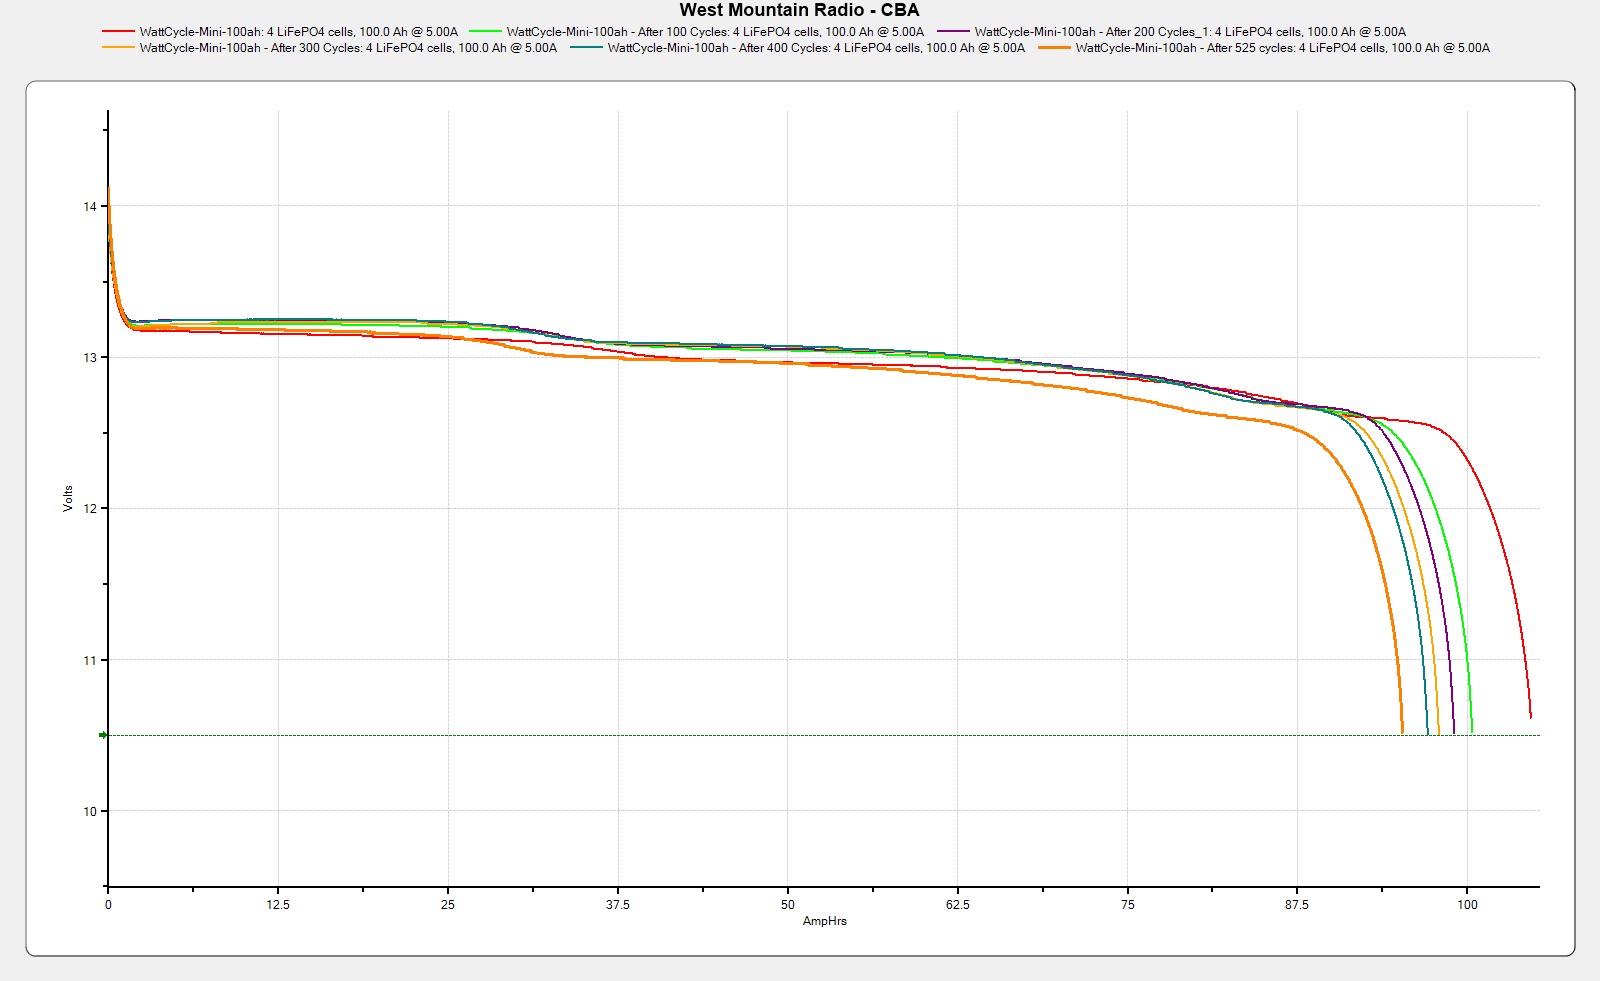
My first round of testing utilized a WattCycle 12-volt, 100 amp-hour Mini battery. This is a value priced — currently $170.00 — no frills battery. It doesn’t have Bluetooth, heating, or any other premium features. WattCycle’s product specifications rate the battery for 5,000 cycles at 100-percent depth of discharge. That’s a heck of a claim for a $170 battery, so I’m anxious to see how it plays out.
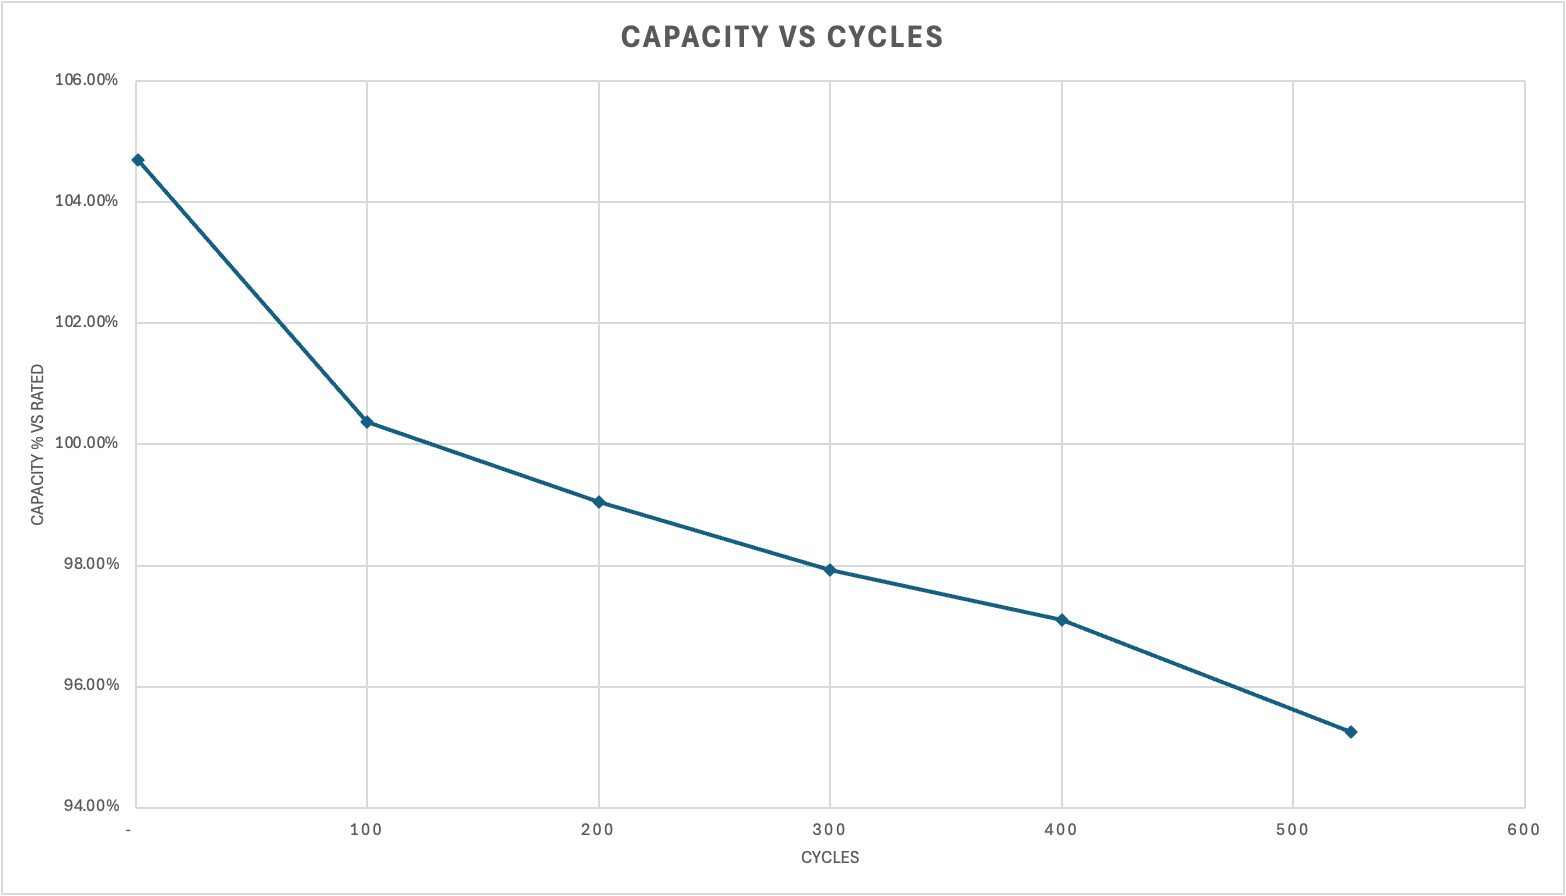
| Cycles | Amp Hours | Percent of Rated Capacity | Capacity Lost or (Gained) | Predicted cycles to 80% & EOL |
| 1 | 104.692 | 104.69% | (4.69%) | |
| 100 | 100.373 | 100.37% | (0.37%) | |
| 200 | 99.051 | 99.05% | 0.95% | 4,215 |
| 300 | 97.927 | 97.93% | 2.07% | 2,894 |
| 400 | 97.1 | 97.10% | 2.9% | 2,759 |
| 525 | 95.249 | 95.25% | 4.75% | 2,210 |
| 600 | 94.87 | 94.87% | 5.13% | 2,343 |
The chart and table above show capacity results starting at 1 cycle and continuing through 525 cycles. The last column in the table extrapolates the rate of capacity loss out to 80-percent to determine when the battery will reach end of life (EOL). As you can see, the predicted number of cycles the battery will survive is coming down with each one hundred tests. There isn’t any reason to expect the rate of capacity loss will be linear throughout the battery’s life. So, although one can extrapolate from these numbers, it’s not clear that extrapolation will prove accurate. The only thing I can do to assess that accuracy is to let the testing continue until I reach that 80% number.
Updated December 2, 2025 — The battery reached 600 cycles and I’ve done another capacity test. Interesting to see the rate of decay slow and the predicted number of cycles increase for the first time. I am very curious to see what happens at 700 cycles and weather the plateau extends or if aging accelerates again.
Testing questions
Right now, the battery stores about 95 amp hours. Current trends point towards the battery holding less than 90 amp hours within 550-600 cycles. So, what do I do then? Should I be adjusting the depth of discharge with each full capacity test? Honestly, I’m not sure. I haven’t thus far, so I’m not going to start now. Once capacity dips below 90 amp hours, I’ll have to make some adjustment. The next question that comes up is with the 20 hour rate. Currently, all 20-hour, full capacity tests are done with a discharge rate of 5 amps as that’s 1/20th the battery’s rated capacity. Should I be adjusting that rate as the tests continue and the battery’s capacity diminishes? I don’t suspect it really matters as LiFePO4 batteries have very low Peukert’s law exponents, meaning rate of discharge doesn’t typically impact capacity much.
Future testing
My immediate testing plans include running this battery until it reaches 80 percent of its original 100 amp-hour rating or 80 amp-hours. Once I wrap testing on this battery, I’m planning on sliding another battery in as well. I would love to test multiple batteries as the same time, but the cost of the equipment to make that happen begins to become prohibitive. It’s especially problematic with larger capacity batteries. For example, to test a large battery, like a 460 amp-hour model, at the same rates, I would need six Orion XSs in each direction or a total of 12 of them. Plus, my storage battery would need to grow to a bank of at least double the capacity of the test battery. So, although I hope to continue this testing, I might have to get creative about how to fund the testing.
Final thoughts
This is an interesting experiment and I think it’s important to know more about the accuracy of battery ratings. But, I wouldn’t lose sleep over whether your battery will last 2,000, 3,000, or even more cycles. The reality is that just 2,000 cycles is 200 cycles a year for ten years. I would venture a guess that the vast majority of boaters cycle their batteries less than 50 times a year. So, let’s use cycle ratings as a way to understand longevity, but probably best not to obsess about them.
If you’ve made it this far, like me, you’re a true battery geek. For others with the same curiosities, I’d love to hear what additional testing I should embark on. So please, leave your suggestions in the comments and let’s see what we can figure out.


Ben, Don’t forget all WC batts have overcharge-protection, even non BT models. If the cells get out of balance you won’t fully charge it before the FET’s cut out.. How are you ensuring cell balance? Considering my 2009 Winston cells still deliver slightly in excess of 100% capacity at nearly 17 years old I suspect Wattcycles OCP…..
Rod, Good point. With a non-BT battery I am limited in terms of how I can check cell balance. However, I can check for full charge protection (FCP) by making sure the charge acceptance curve shows a smooth line towards 0 amps. If I see a jagged move from low charge acceptance to none, I would conclude the battery has entered FCP. I see a smooth curve all the way down to 0.10 amps of charge acceptance and with a pack voltage of 14.2 volts. Charge acceptance smoothly ramps down while pack voltage smoothly moves up. All my testing with FCP sees a blocky movement to charger voltage and 0 amps when FCP cuts in.
I also think there is a point where FCP is part of the manufacturer’s decision about how to manage charging. I’m charging to 14.2 volts which is below their recommended maximum and definitely high enough to achieve full charge on a 12v LiFePO4 battery. If their charge management features compromise battery charge, I think there’s a decent argument that showing that in the tests is fair.
-Ben S.
Excellent article Ben. looking forward to the next chapter.
For the question about changing the parameters of the capacity test as capacity gets below 90%. I would not change anything arguing that as a consumer you would expect similar performance new as when you get close to 2000 cycles or whatever the claimed life is. Also a battery nerd here. Got some Toshiba LTO batteries and made my own solar backup and also made some for the boat and with the Wakespeed WS 500s run the boat at 15.8v.
Thanks Paul. That’s the way I’m leaning right now.
-Ben S.
Very cool test. Excited to follow along. Thanks Ben
Great Article Ben!
Excellent testing Ben. Of course with Rod watching, do you realize you’ll need to repeat the test with 13.8V charging (plus cell balancing absorption time) to see how the battery life is extended?! 🙂
Most of my experience shows that people tend to fit oversize banks when they change to LFP’s, so tend to cycle them lightly (and often at relatively low C rates). Calendar ageing tends to be the bigger issue….
Excellent testing & a good point about oversizing.
Curious about calendar ageing as it seems more likely to be the largest factor but still at a manageable 1-3% per year? Not perfect but better that flooded lead @ 5-15%. Before posting here I took a look at this deep dive https://diysolarforum.com/threads/cycling-degradation-vs-calendar-aging-w-lifepo4-batteries-used-for-solar-application.94487/
Some talk for those don’t cycle often it may be better to keep their cells closer to 100% SOC as that slows down calendar aging more than the effect of maintaining high SOC. Now one more thing to factor! 😉
Thanks for posting the link, interesting reading!
I re capacity tested one of my first lithiums on the boat following 18 months of light use. Mostly it was sitting around solar float voltages and discovered my Epever reg was a little out, so actual float was just over 13.6V. Capacity test was within 0.85% after that time so figured it’s largely academic with over capacity fitted. From memory the BMS showed 18 cycles, so almost no cycling.
Certainly benefits from being under a berth in the bilge area. Summer temps peak around 20 degrees C (68F) and winter is down to around 7C (45F) so clearly the low temperatures help….
Have you tested the new Trojan T105-aes 6v agm? They are claiming 1200 cycles at 100% DOD.
If they do close to that I don’t see changing to Litium. I have been using a 900ah, 6v single bank lifeline agm for 5 years, which is simple and has worked well. I will likely replace with the Trojans when it’s time.
The battery crossed 600 cycles and I tested capacity down to 10.5 volts again. This time, the rate of decay has definitely slowed. I updated the table above with those results.
-Ben S.