
Installing and configuring a Victron battery monitor
Deep cycle, house batteries can be critical to enjoying time on your boat away from the dock. But, as boaters, we often fail to consider what’s happening with our batteries. A battery monitor helps us understand what’s happening with our electrical system and our batteries. For many owners, ignorance may be bliss when it comes to their house banks. However, that bliss can come to a screeching halt when you find yourself prematurely murdering your batteries. The solution? A battery monitor. This article will walk you through the basic process of installing a Victron battery monitor and the critical settings to ensure accuracy.
After years of trying many different monitors, I seem to always return to Victron’s BMV and SmartShunt battery monitors. I’ve found Victron’s monitors to be accurate, simple, and importantly to me, they integrate with Victron’s excellent Victron Remote Management (VRM) portal.
I’ve tried my best to stick to the relevant details you need to know to install and configure a battery monitor. Rodd Collins at marinehowto.com has a great article on how to install a battery monitor that gives a complete step-by-step guide to installing a monitor. Additionally, he has an in-depth article on improving the accuracy of your monitor. But, if all of that is too much reading, I have included a table with starting point values. However, to get the best possible results from your monitor, you should understand the configuration options and tailor them to your specific installation.
BMV vs SmartShunt
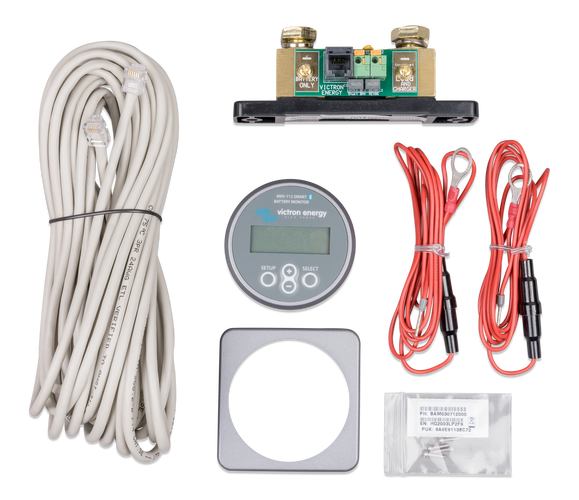
Victron offers a comprehensive line of monitors for voltages ranging from 6.5 to 385 volts and with maximum amp ratings from 500 to 2,000 amps. For boaters (and RVers and anyone else using 12, 24, and 48-volt systems), the two most common monitors will be the BMV series (particularly the BMV-712 Smart) and the SmartShunt. Both monitors are available in 500, 1,000, and 2,000 amp capacities and are suitable for 6.5 to 70 volts.
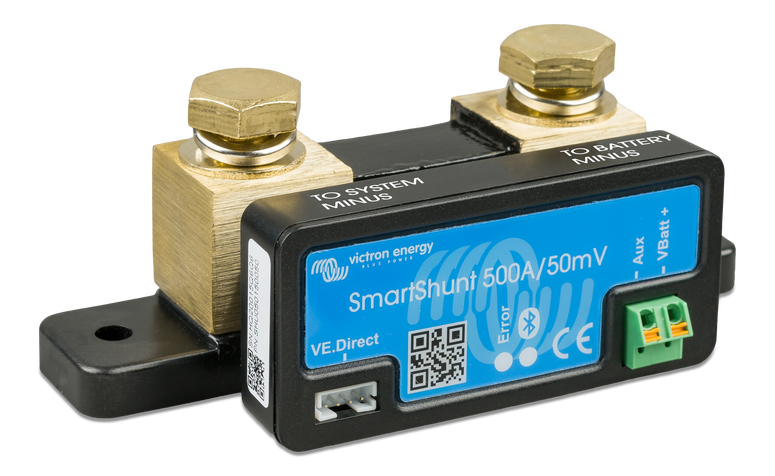
The primary difference between the BMV and SmartShunt monitors is the gauge-type display. BMVs all include the gauge display and put the intelligence of the unit in the gauge. The self-contained SmartShunts have all their electronics right on the side of the shunt. For the most part, the decision comes down to whether you want a separate display or are content to display the information via Venus OS / VRM and VictronConnect via Bluetooth.
Additionally, the BMV series monitors include a programmable relay. The relay is configurable to trigger based on low voltage or low state-of-charge. The relay allows shedding loads or starting a generator in response to a low battery. SmartShunts don’t include relays.
Victron’s battery monitors are, like many other battery monitors, coulomb counters. Unless you’re an electrical engineer or spend far too much time on electrical subjects (like me), you probably haven’t heard of a coulomb. All you really need to know is that these meters count how much energy passes through them, and then do a bunch of math to determine the batteries’ state of charge (SOC).
Installation
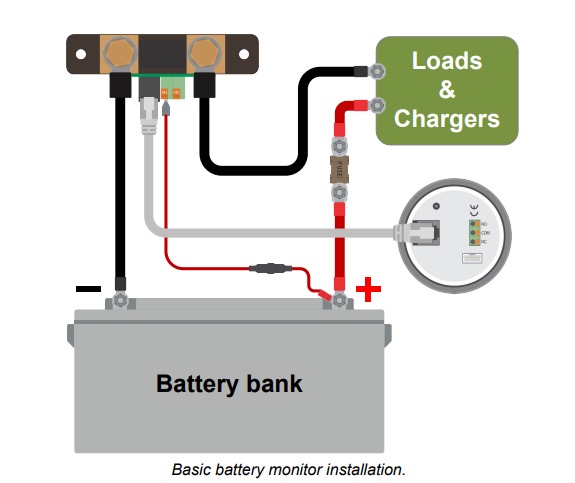
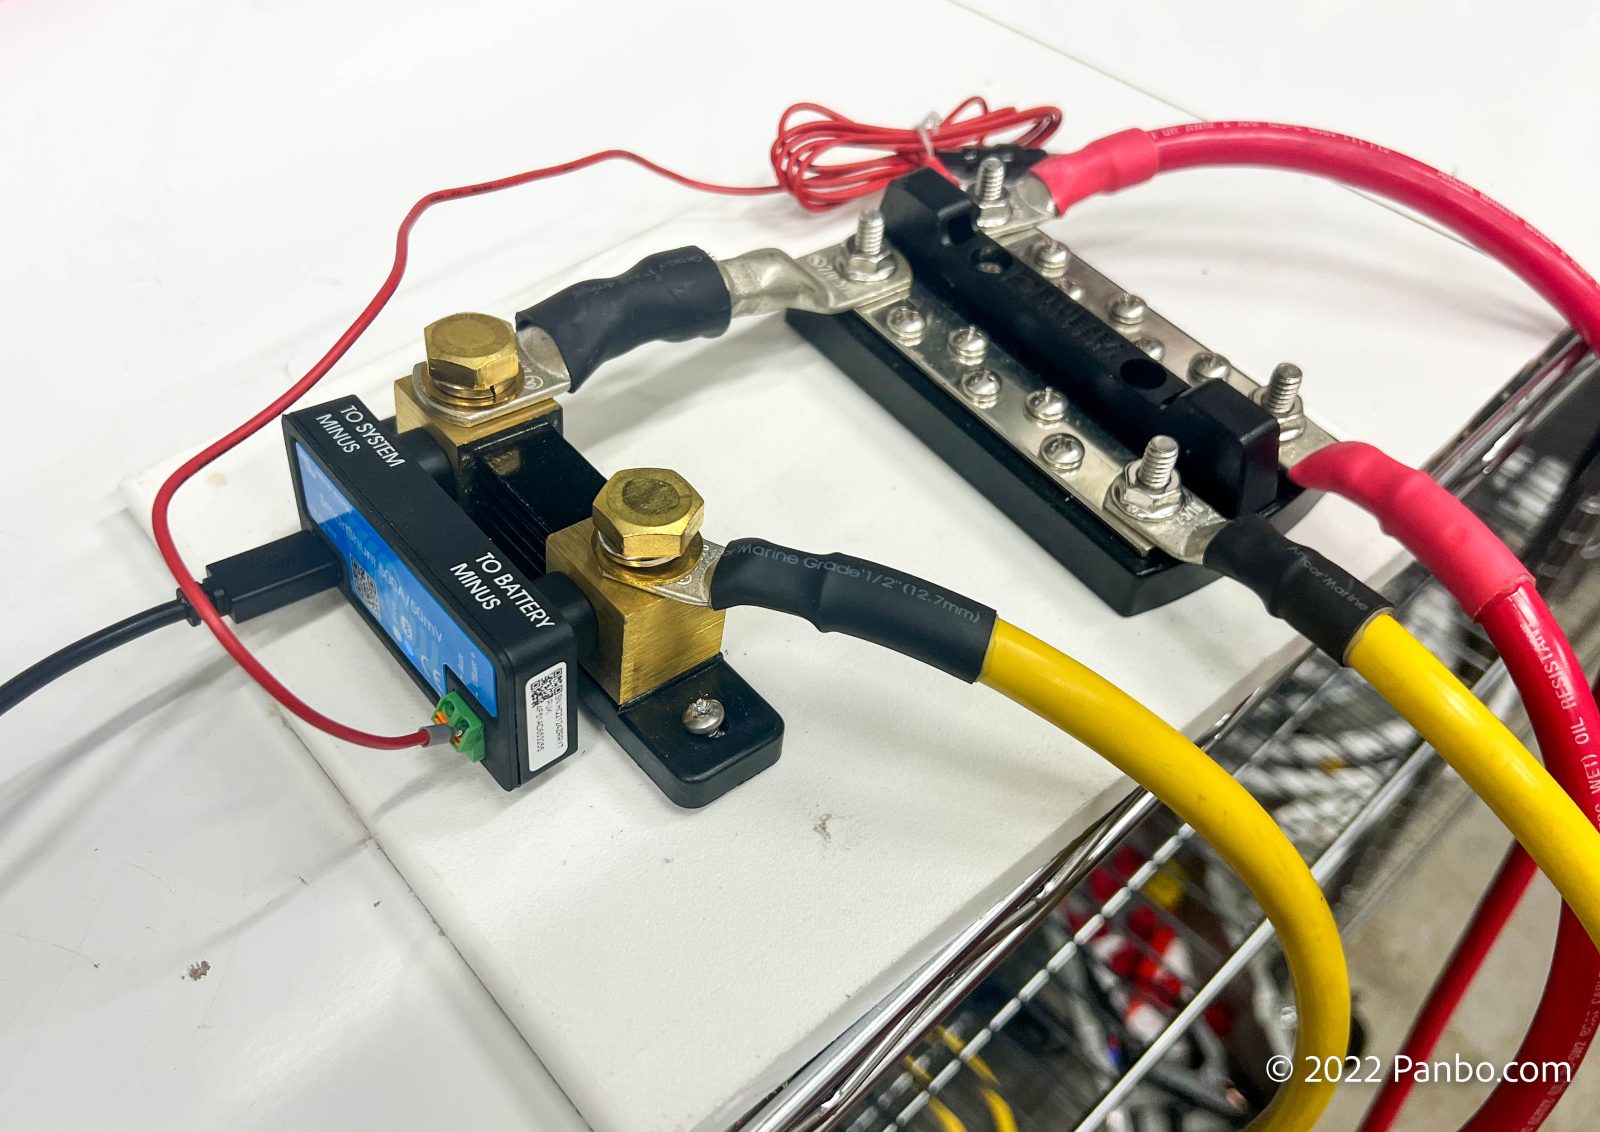
Installing a SmartShunt or BMV is nearly identical. The only difference between the two is the rj-11 phone-style cord that connects the display to the shunt on a BMV. The shunts must be the first device connected to the negative of your battery or battery bank. All current that flowing from the battery or bank must pass through the shunt. The most common cause of inaccuracy in coloumb counting battery monitors is a load connected to the battery and bypassing the shunt.
The only other required connection is a fused connection to the positive side of the battery. Optionally, both BMVs and SmartShunts have a second monitoring connection. You can monitor the voltage of a second battery bank, the mid-point voltage of the primary battery bank, or battery temperature.
If the monitor will be connected to a GX device like a Cerbo, Venus, Color Controller, or Raspberry Pi running Venus OS, the last step is to run a VE.Direct cable from the monitor to the GX Device.
Configuration
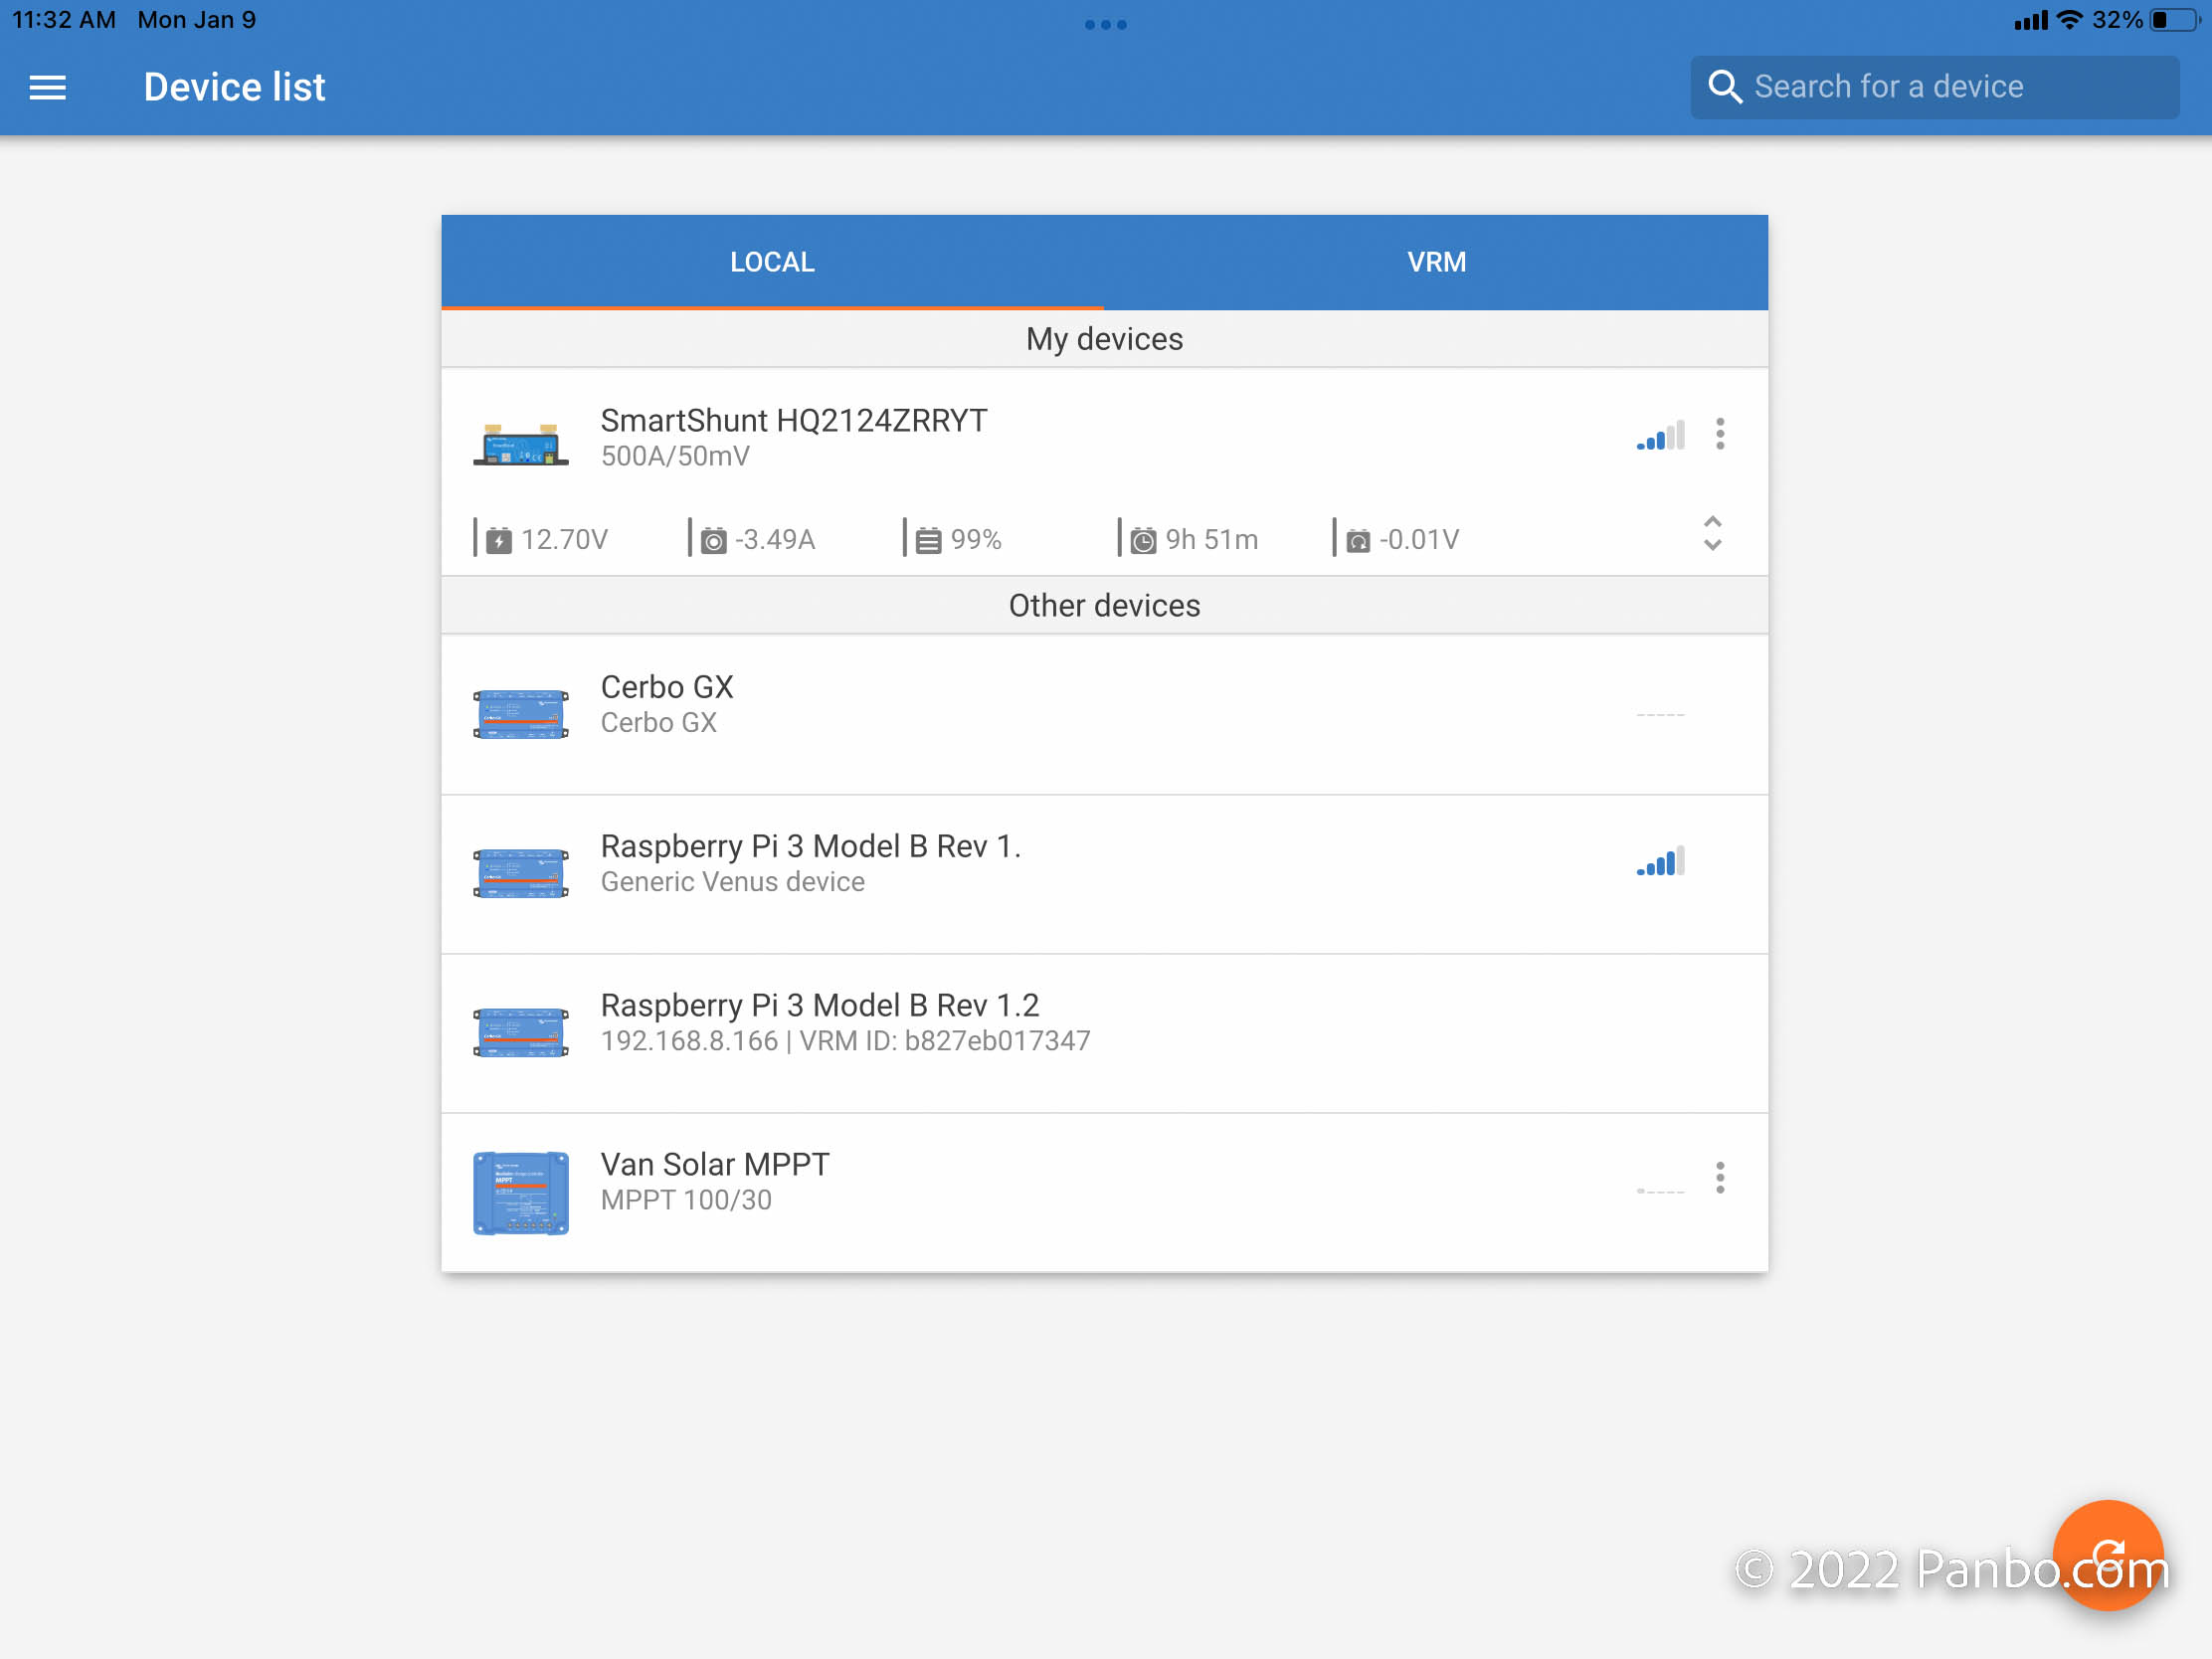
The two most important factors in ensuring your battery monitor provides accurate results are making sure the monitor is the first device after the battery and properly configuring the monitor for your battery or batteries. VictronConnect allows you to configure Victron’s Bluetooth-equipped devices. As long as you’re within Bluetooth range, you can view status, update firmware, and configure your device. In the screenshot above, I’m viewing all in-range Victron equipment.
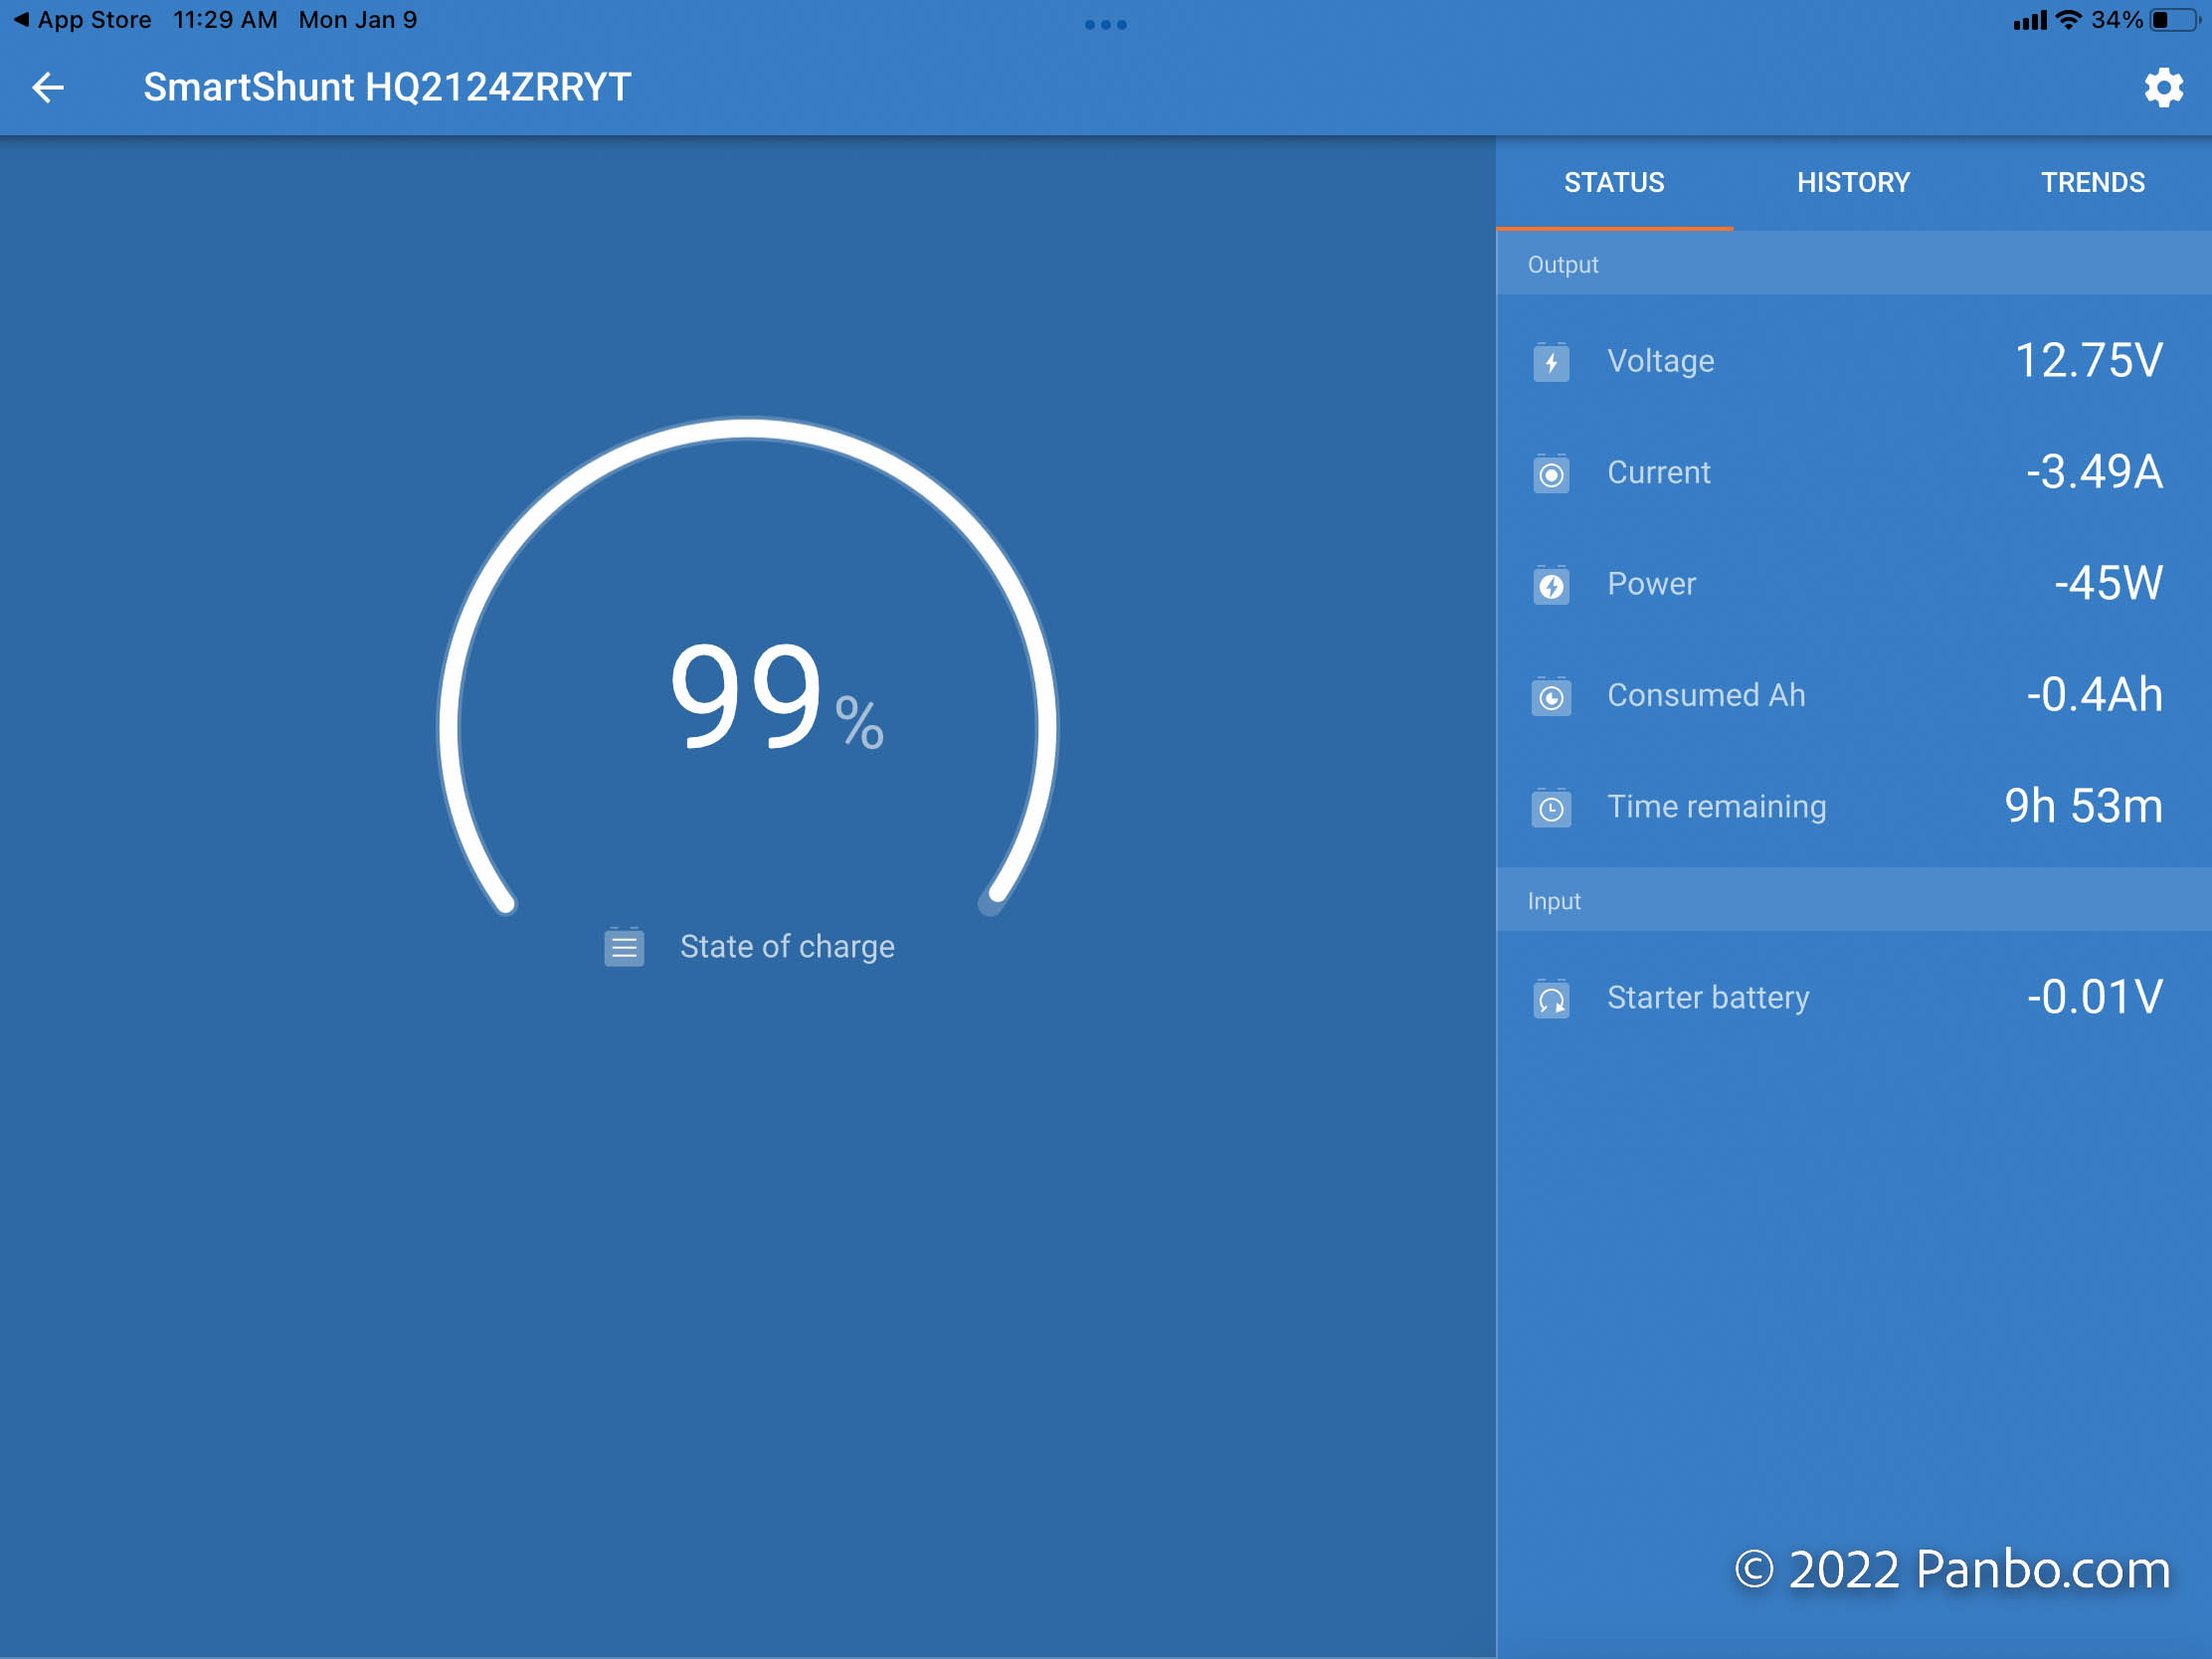
When I click on the SmartShunt, the status screen above loads. This shows what’s happening with the battery currently. We’ll talk more about these values and what they mean in a bit. For now, I’ll click the gear icon in the top right to bring up the settings menu and select “Battery settings.”
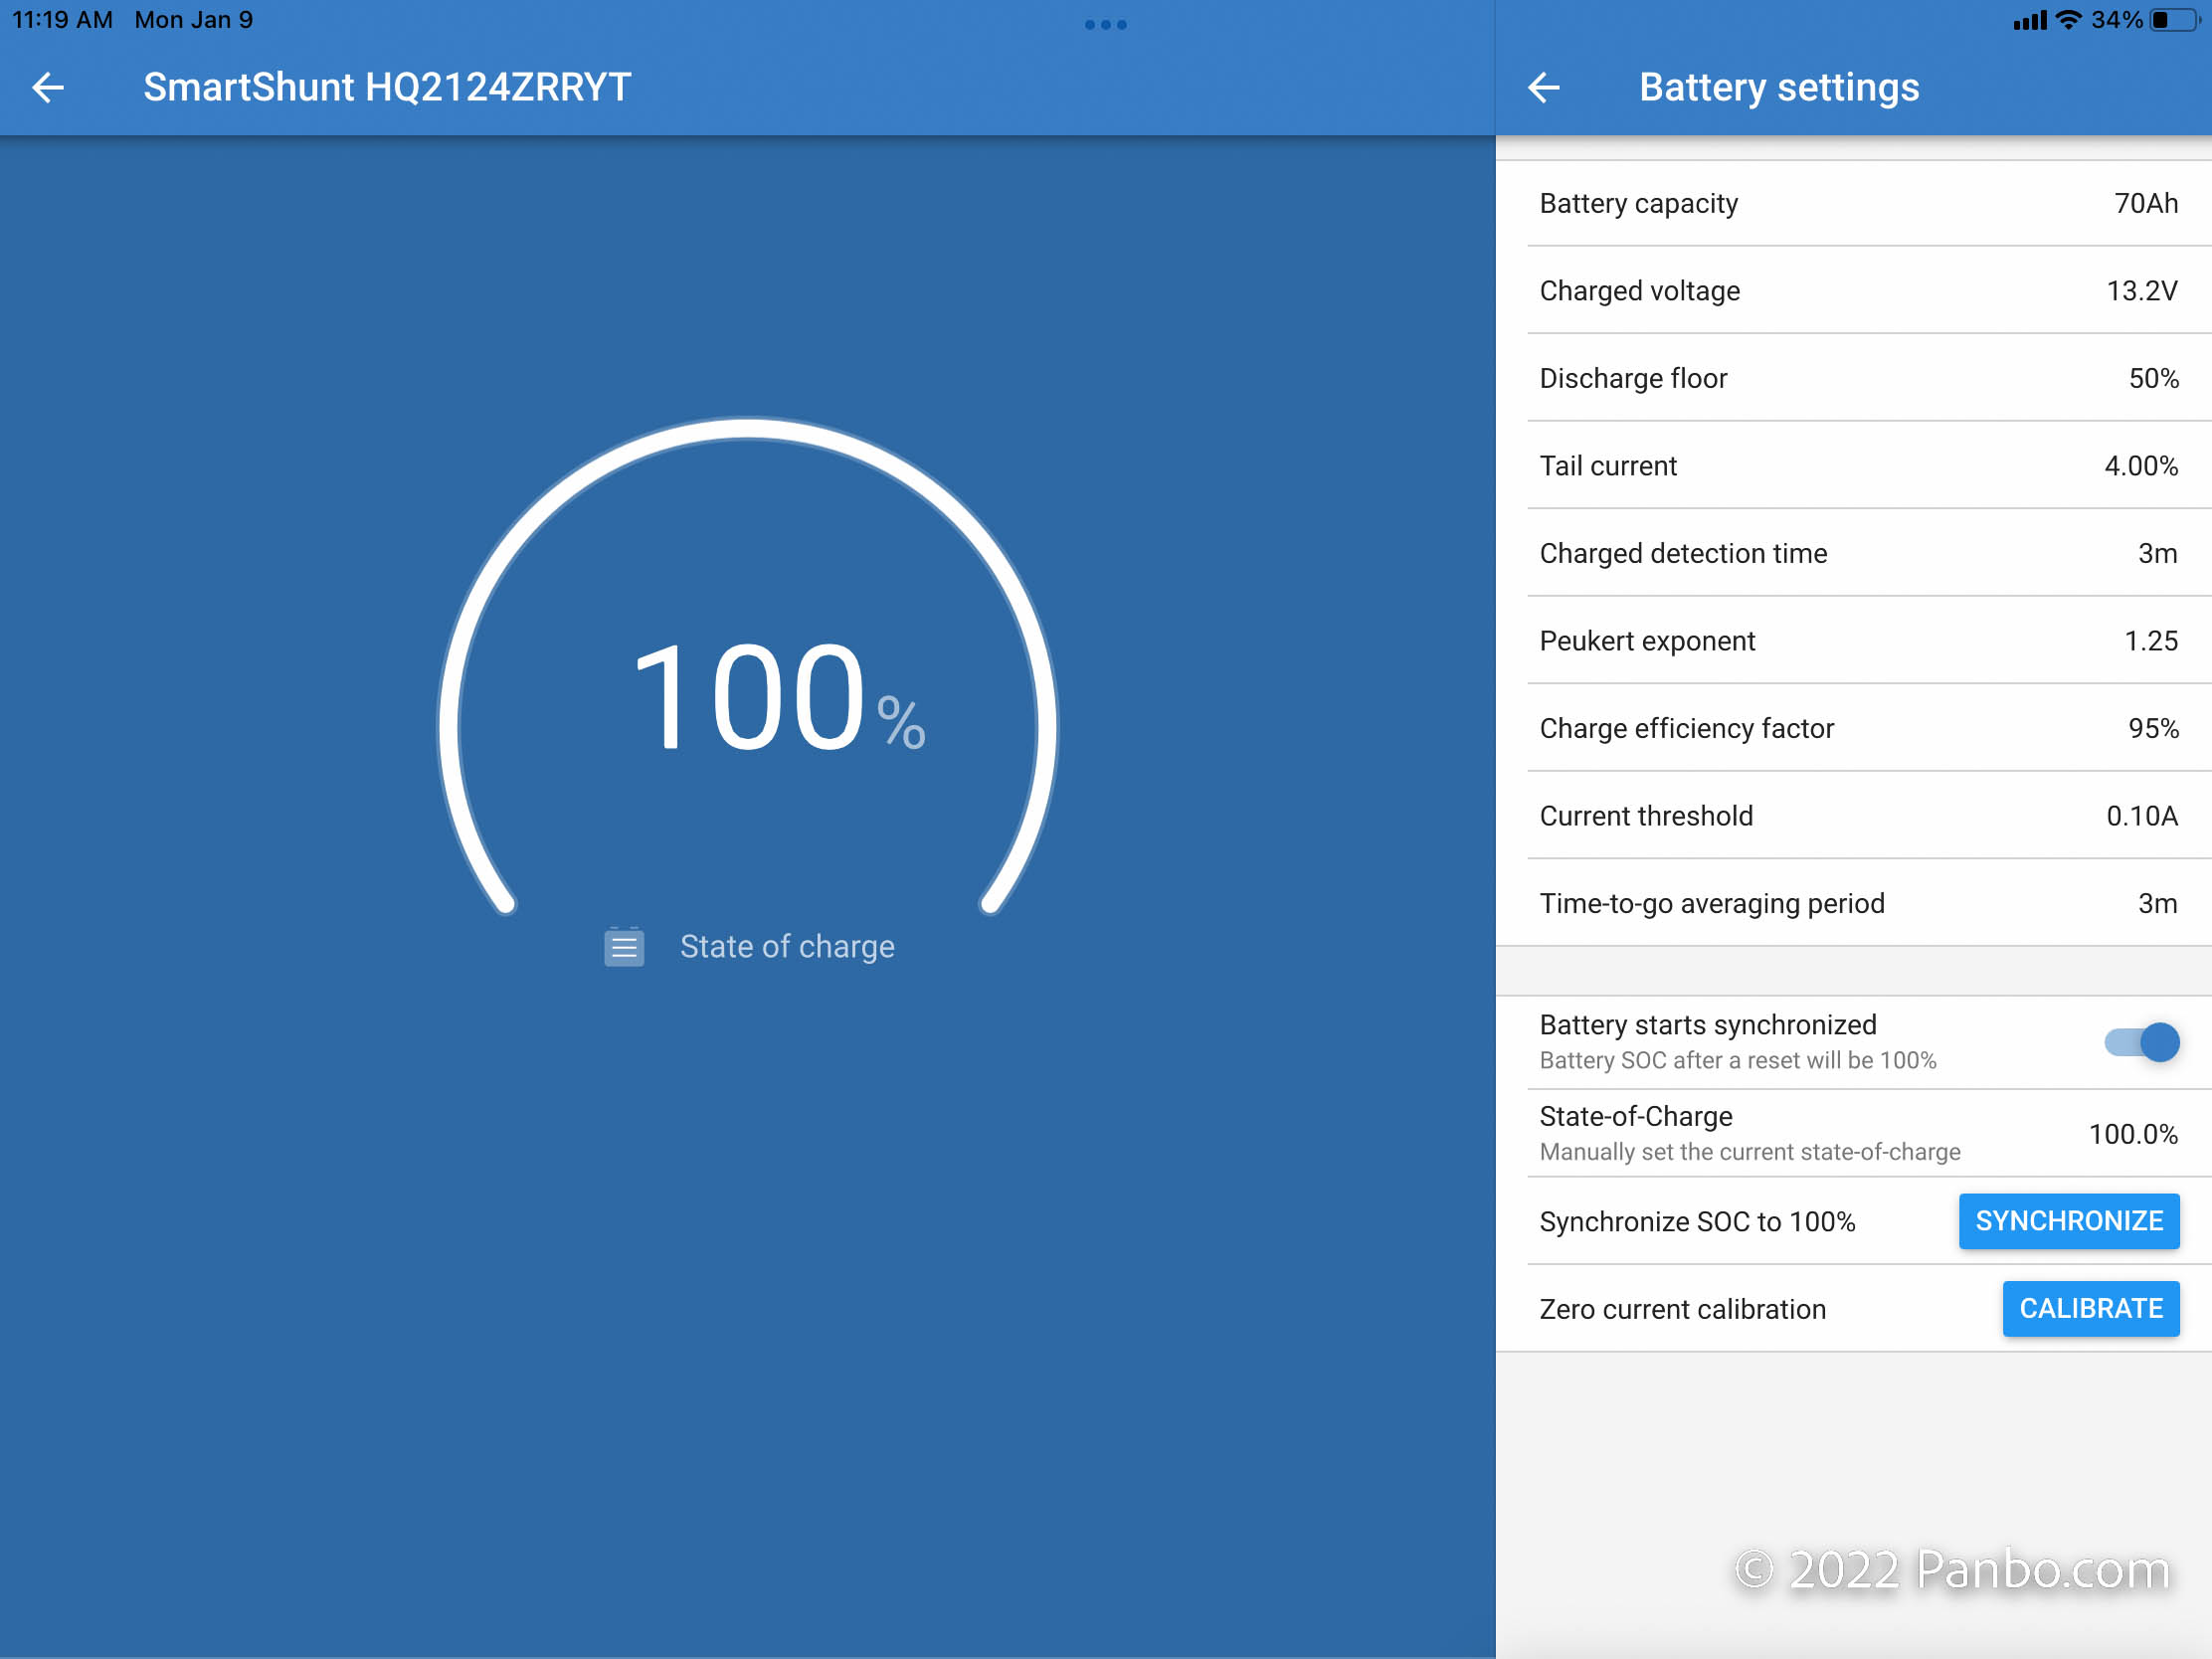
Selecting Battery settings brings up the menu you see above. Each of the nine parameters controls how the battery monitor calculates battery statistics.
Battery capacity
Starting at the top, we have battery capacity. This value is the basis for nearly every calculation your battery monitor performs.
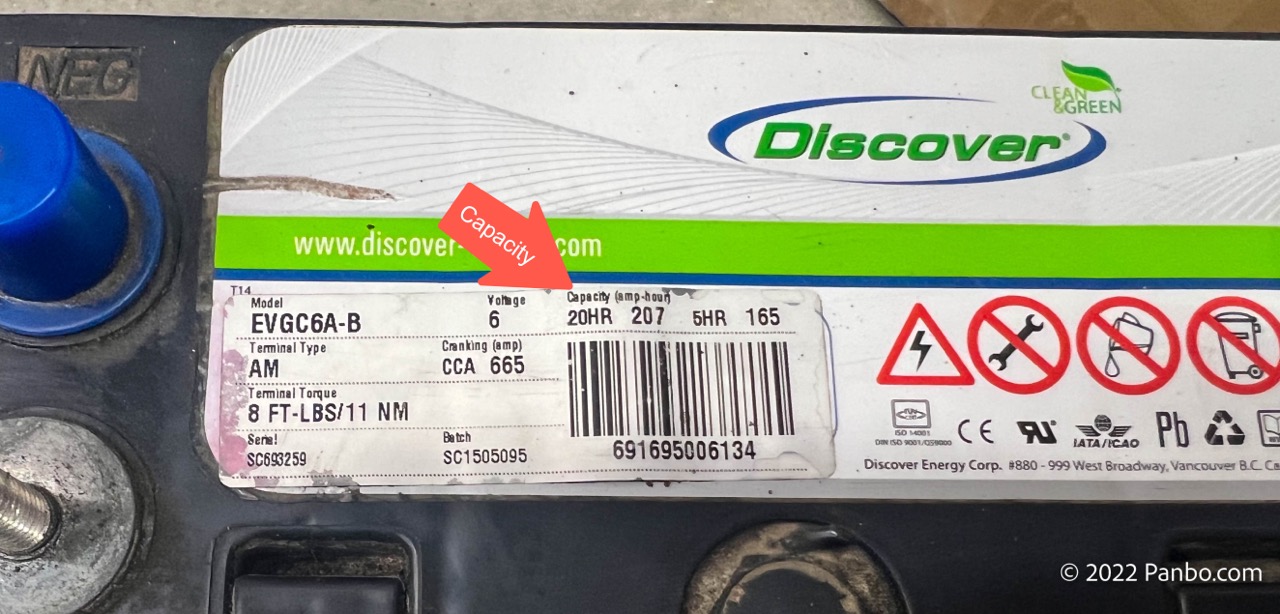
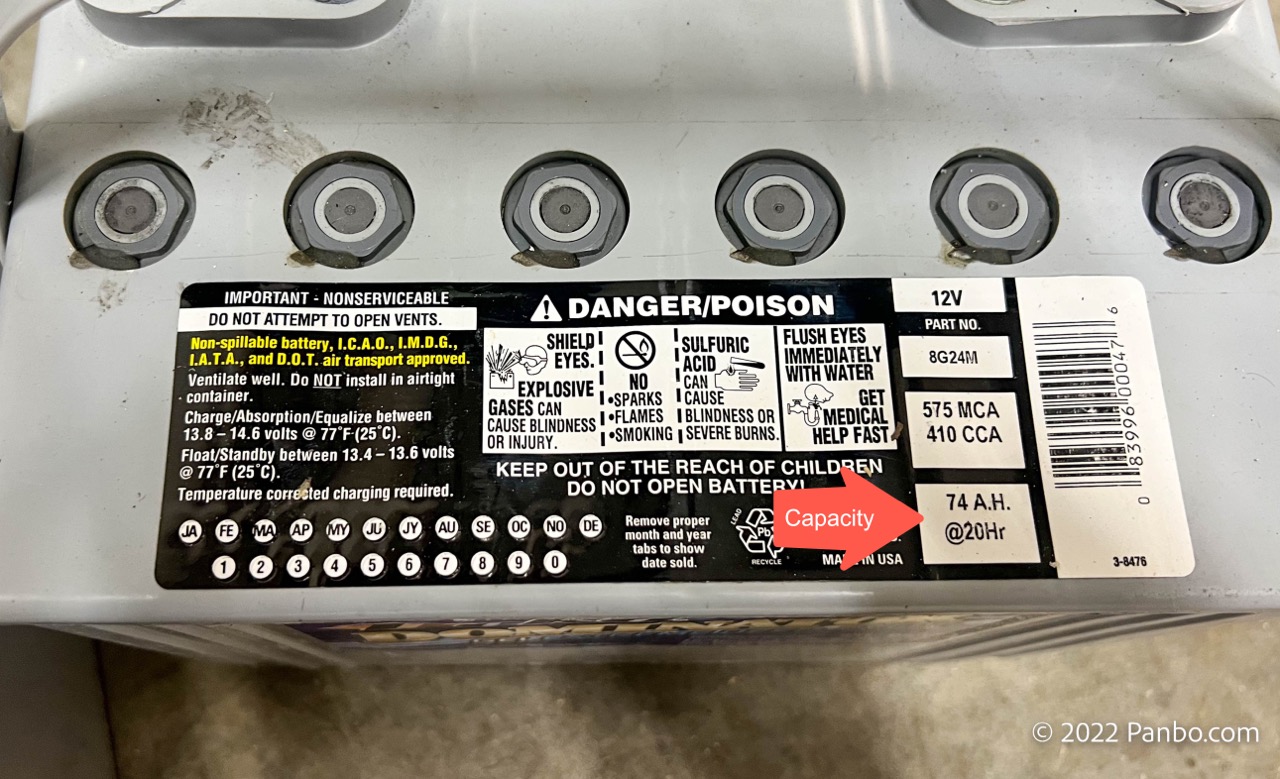
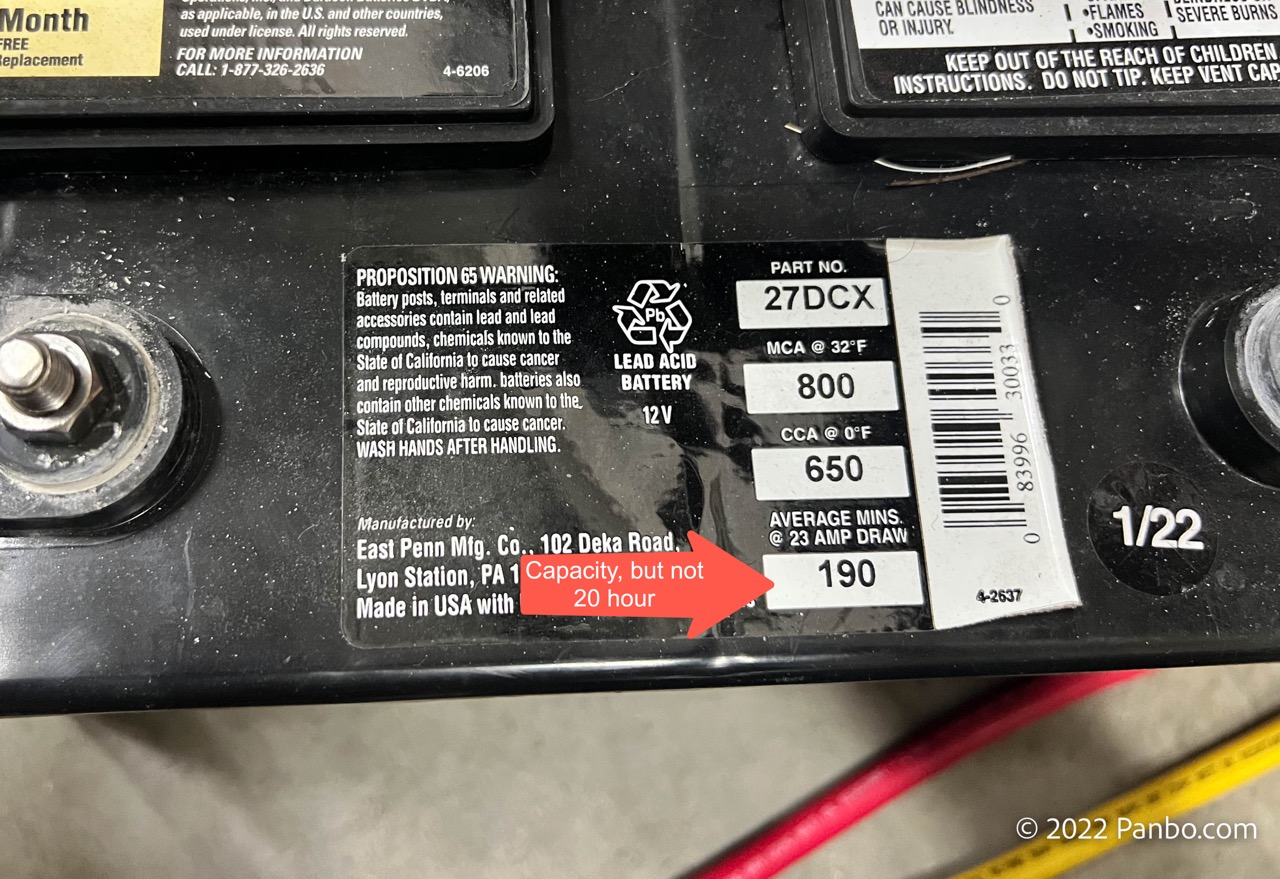
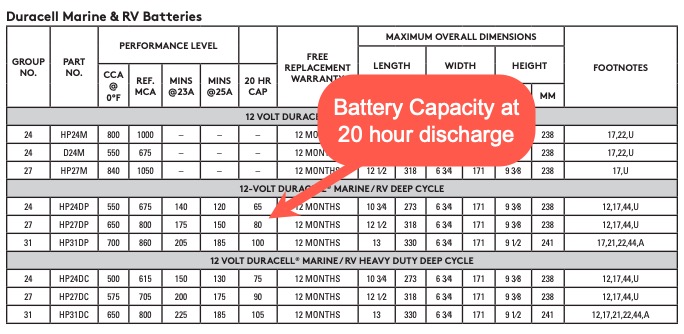
Battery capacity represents the total capacity of the battery in amp hours. On deep-cycle batteries, it’s very likely this information will be found on the battery label. I quickly surveyed some batteries I had lying around my shop and found that, despite all being deep-cycle, only two of the three listed their 20-hour capacity. For the third, a Duracell made by Deka East Penn, I had to go to the spec-sheet. 20-hour capacity is the most common representation of a battery’s capacity. As we will discuss in a bit, for most batteries, the faster they’re discharged, the lower their capacity.
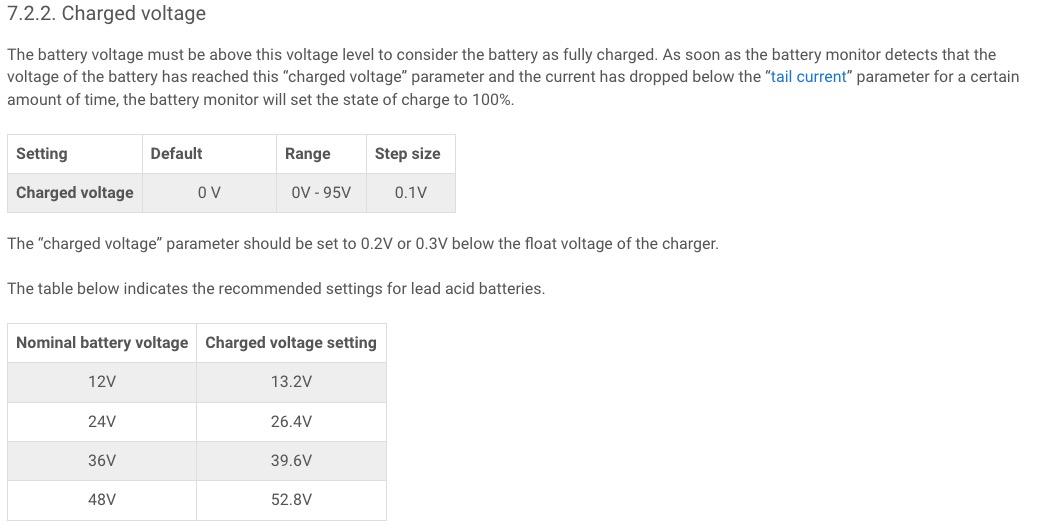
Charged voltage, Tail current, and Charged detection time
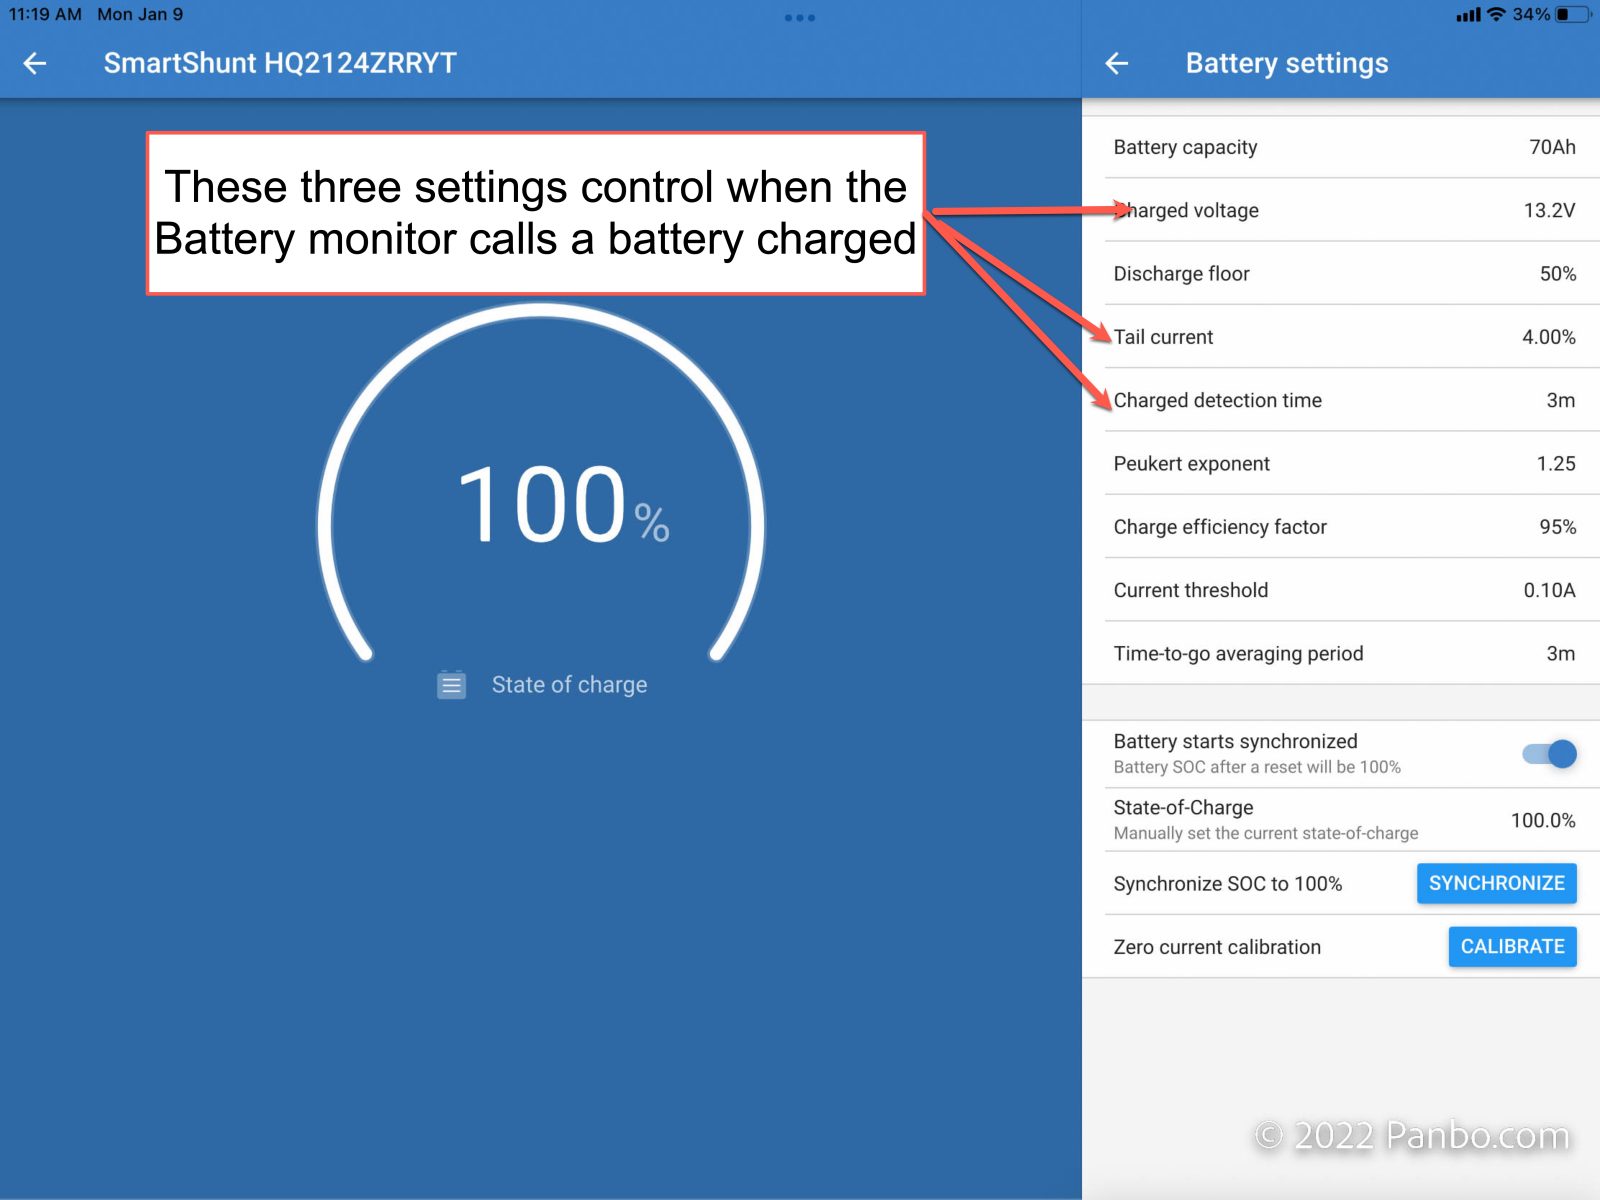
The next three values control when the monitor calls a battery fully charged. Battery monitoring isn’t an exact science. What the monitor displays is its best estimate of the battery’s current state of charge (SOC). To try and keep that number as accurate as possible, the monitor synchronizes or resets to 100 percent SOC when the battery appears fully charged. Setting charged voltage, tail current, and charged detection time tells the monitor what we call fully charged.
Charged voltage tells the monitor the voltage at which we consider the battery charged, but that occurs in conjunction with tail current. For the monitor to consider the battery charged, the charge current (amount of current the battery is currently accepting from the charger) has to be below the threshold. In the case of the screenshot above, the battery capacity is 70 amp-hours, and the tail current is 4 percent. So, to call the battery charged, the tail current needs to be below 2.8 amps (70*.04=2.8).
Charged detection time is the final variable to call the battery fully charged. The monitor synchronizes the battery to fully charged when both charged voltage and tail current thresholds meet their thresholds for longer than the charged detection time. I have charged detection time set to three minutes. So, for the monitor to synchronize the battery at 100% SOC, the voltage must be above 13.2 volts and the charge rate must be below 2.8 amps for at least three minutes.
Discharge floor
In most cases, batteries last longer if operated within a range specified by the manufacturer. For flooded lead-acid batteries, that typically means not discharging the batteries below 50 percent. So, I’ve told the monitor that my discharge floor is 50 percent. That means time-to-go calculations assume we aren’t discharging below that point.
Peukert exponent
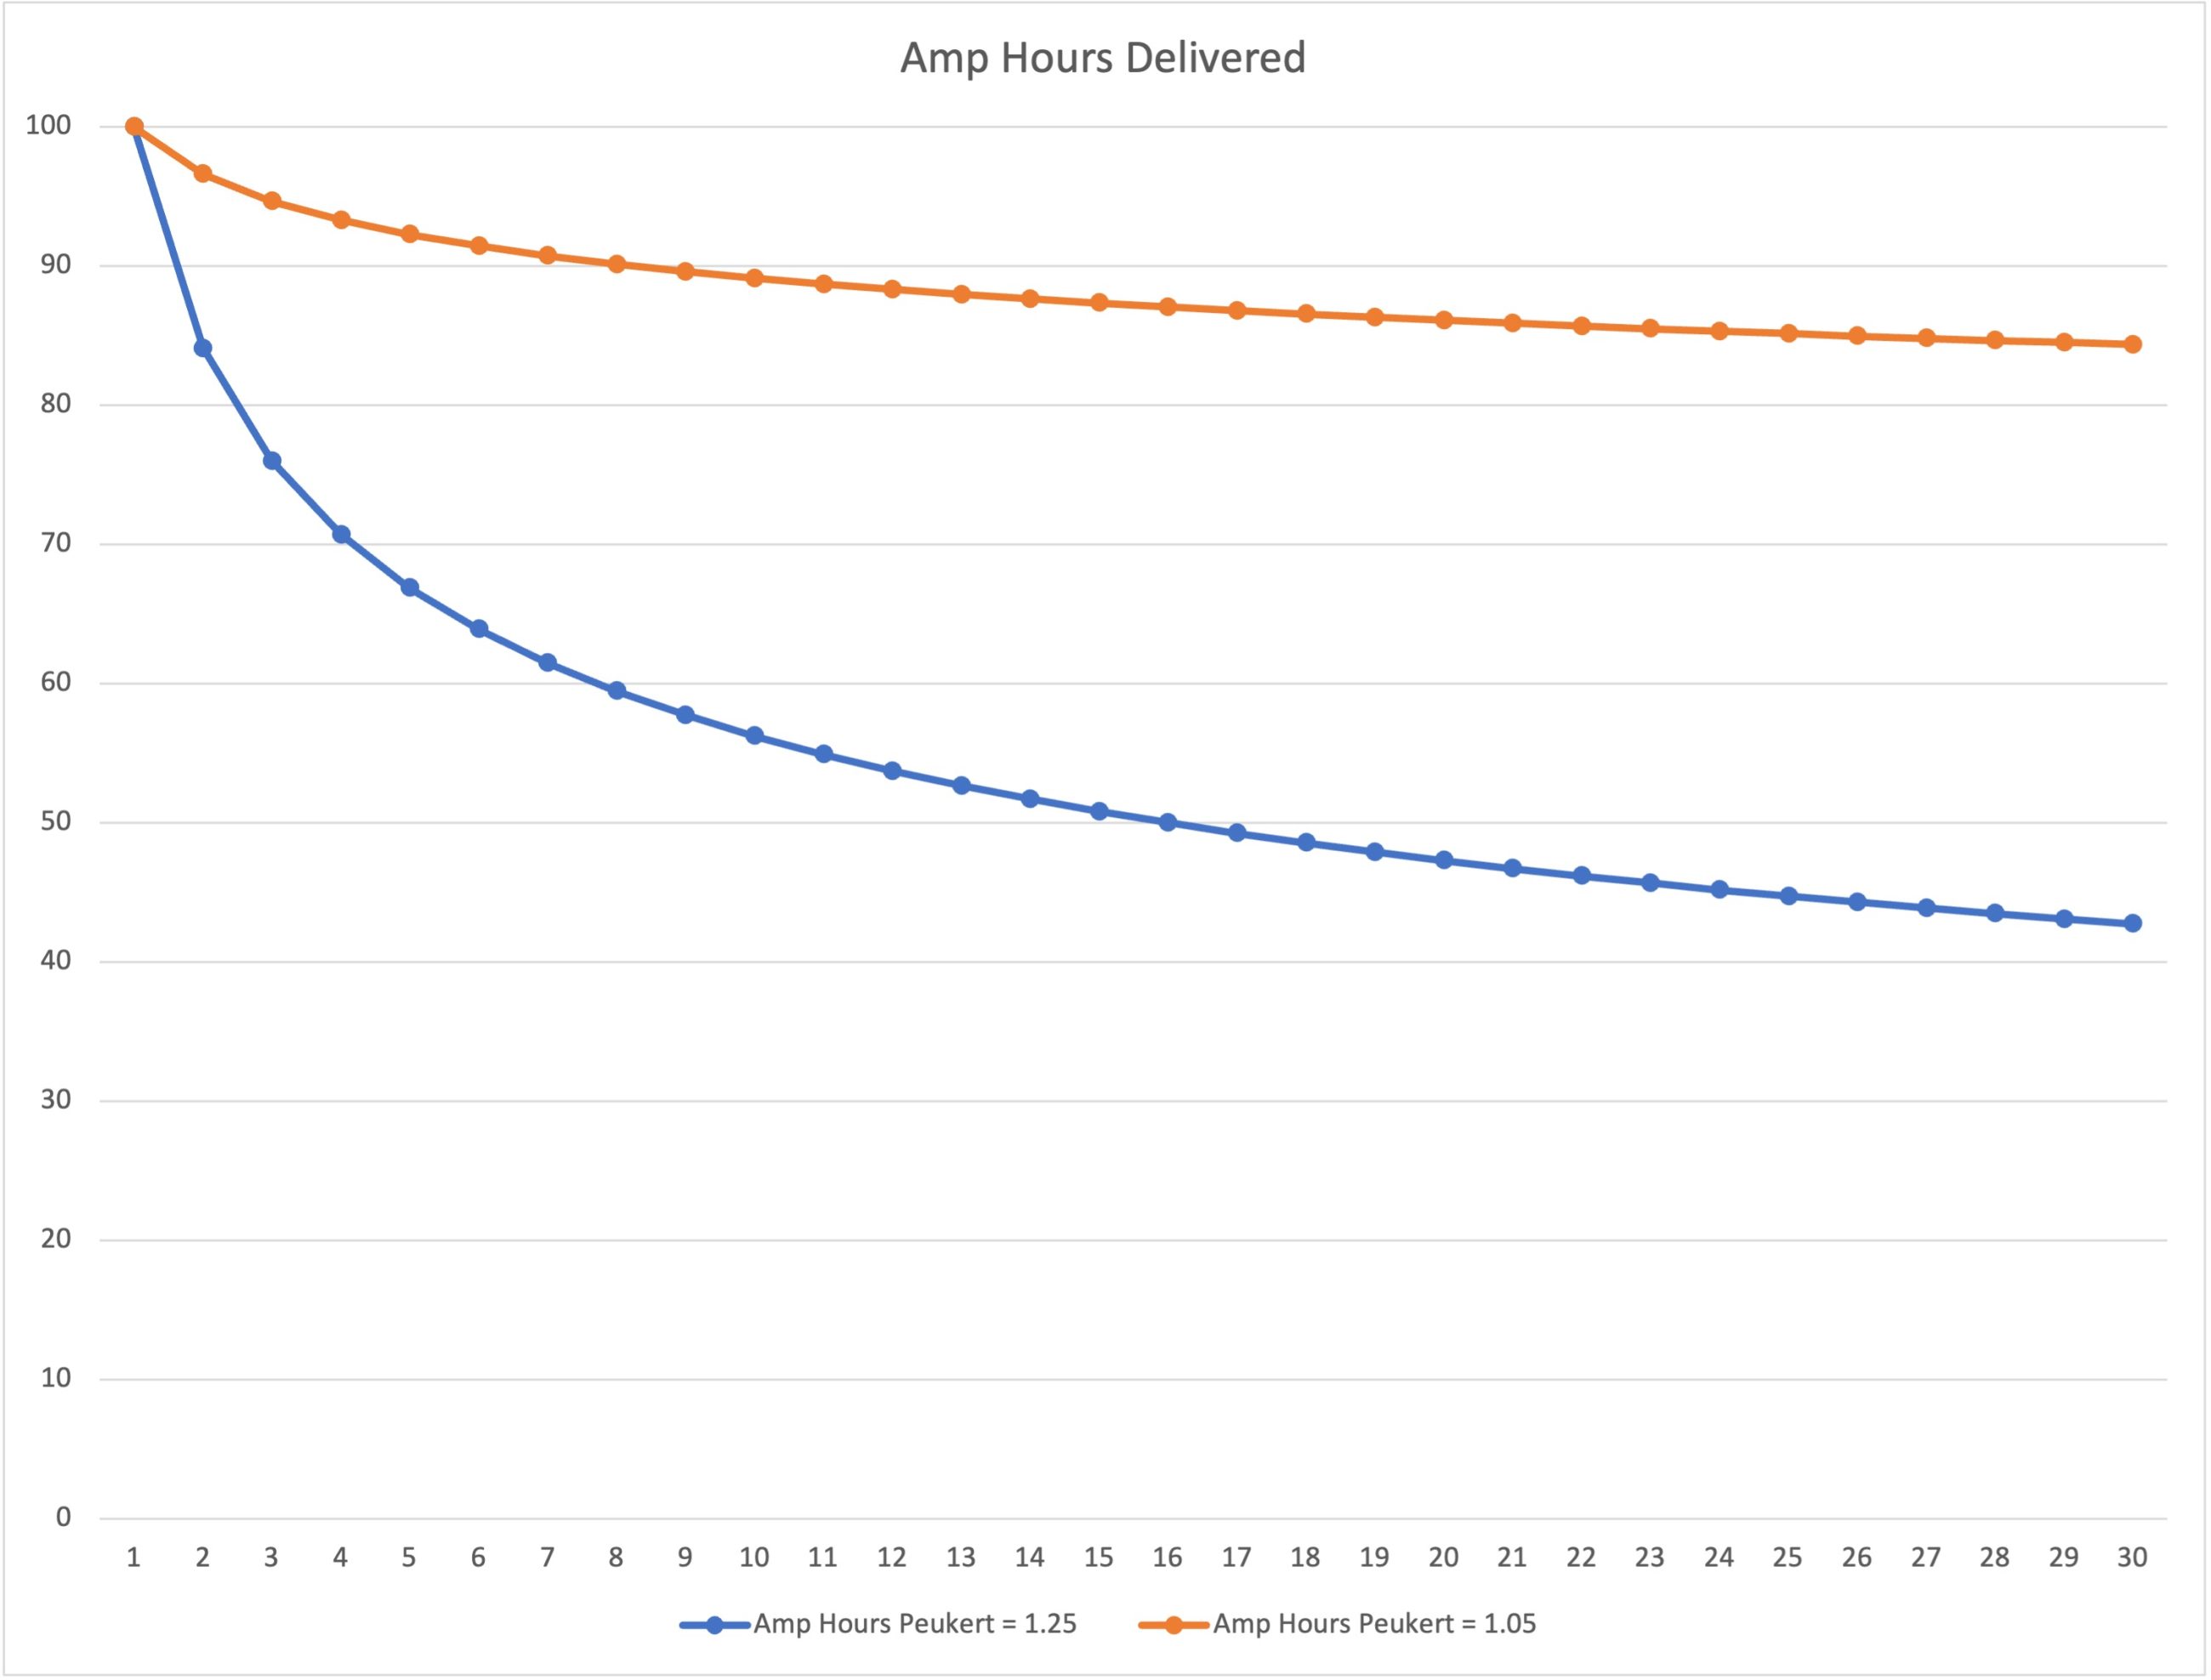
We tend to think of a battery as a tank of energy we draw from. If our tank holds 100 amp hours, there are 100 amp hours available to draw, at any rate. The reality is that’s not how it works. The faster we discharge a battery, the less energy it delivers. Peukert’s law approximates the relationship between speed of discharge and total energy delivered. A constant, called the Peukert exponent, represents the impact of faster discharge on total capacity. The higher the constant, the more capacity is reduced by drawing down the battery faster. The chart above shows two sample batteries. One has an exponent of 1.25 — a fairly typical exponent for lead-acid batteries — and the other has an exponent of 1.05 — a fairly typical exponent for LiFePO4 batteries.

Victron’s instructions go into great detail on Peukert’s equation and exponent. They thoroughly explain the math and even provide a calculator so you can calculate your own exponent. But, at the end of the section, they note they don’t recommend changing the exponent unless you are using lithium batteries. In my own experience, some battery manufacturers provide this information. If they do, I would use their number. For their LiFePO4 batteries, Battle Born recommends 1.05.
Current threshold
Current threshold sets a minimum current measured. If the measured current is below the threshold, the monitor ignores the measurement. This avoids erroneously measured, very small values incorrectly drawing down state of charge values. In practice, at least in all of my installations, it’s very rare to see a system with this little power draw. I don’t typically change this value and haven’t seen inaccuracies. If you want to disable the function, you can set the value to 0.
Time-to-go averaging period
Setting the Time-to-go averaging period determines the time period over which the monitor averages your power usage to determine remaining battery life. The monitor determines time-to-go (TTG) by figuring out how many amp hours remain before the charge floor threshold is left. Then, that total is divided by the average power usage over the last x minutes as determined by the TTG averaging period. So, if you set your TTG averaging period to ten minutes, have 80 amp hours available before you will reach the discharge floor, and averaged 10 amps consumption over the last ten minutes, the monitor will determine you have 8 hours of battery life left. Although, depending on the Peukert’s law calculation, the time remaining could be reduced.
I like to set my TTG averaging period to ten minutes. That’s a long enough period that short-duration spikes don’t wildly swing the time-to-go calculation.
Starting point values
I realize there’s a lot to digest in the settings section of this article. What follows is a table with some approximate starting values for flooded lead acid (FLA), absorbed glass mat lead acid (AGM), and LiFePO4 batteries. Individual battery manufacturers may have different values and those should certainly take precedence over my generic values. But, hopefully, this is enough to get you started.
| Parameter | FLA | AGM | LiFePO4 |
| Battery Capacity | Actual capacity | Actual capacity | Actual capacity |
| Charged voltage | 14.2 volts | 14.4 volts | 14 volts |
| Discharge floor | 50% | 50% | 20% |
| Tail current | 2% | 2% | 2% |
| Charged detection time | 3m | 3m | 3m |
| Peukert exponent | 1.25 | 1.25 | 1.02 |
| Charge efficiency factor | 95% | 95% | 99% |
| Current threshold | 0.10A | 0.10A | 0.10A |
| Time-to-go averaging period | 10m | 10m | 10m |
Challenges in systems with solar
A battery with a solar system hooked up presents a unique challenge to battery monitors. As I mentioned above, the monitor marks the battery as fully charged when voltage is over threshold and charge current is under threshold for a defined period of time. When hooked to a typical shore power charger that works just fine. The charger puts out lots of current until the batteries reach full charge. But, what about when the charge source is solar? In that case, battery voltage might make it over your charged voltage setting but, if there’s not a ton of sunlight or you have a smaller solar system, the current might be quite low. The monitor will look at the combination of higher battery voltage and low current and decide, incorrectly, the battery must be charged.
This problem is particularly acute if you, as Victron recommends in the manual, set the charged current 0.2 or 0.3 volts below the float setting of the charger. Instead, I set the charged voltage to 0.2 volts below the bulk / absorption setting of the charger. That higher voltage is only reached as the batteries near 100 percent SOC.
Status monitoring
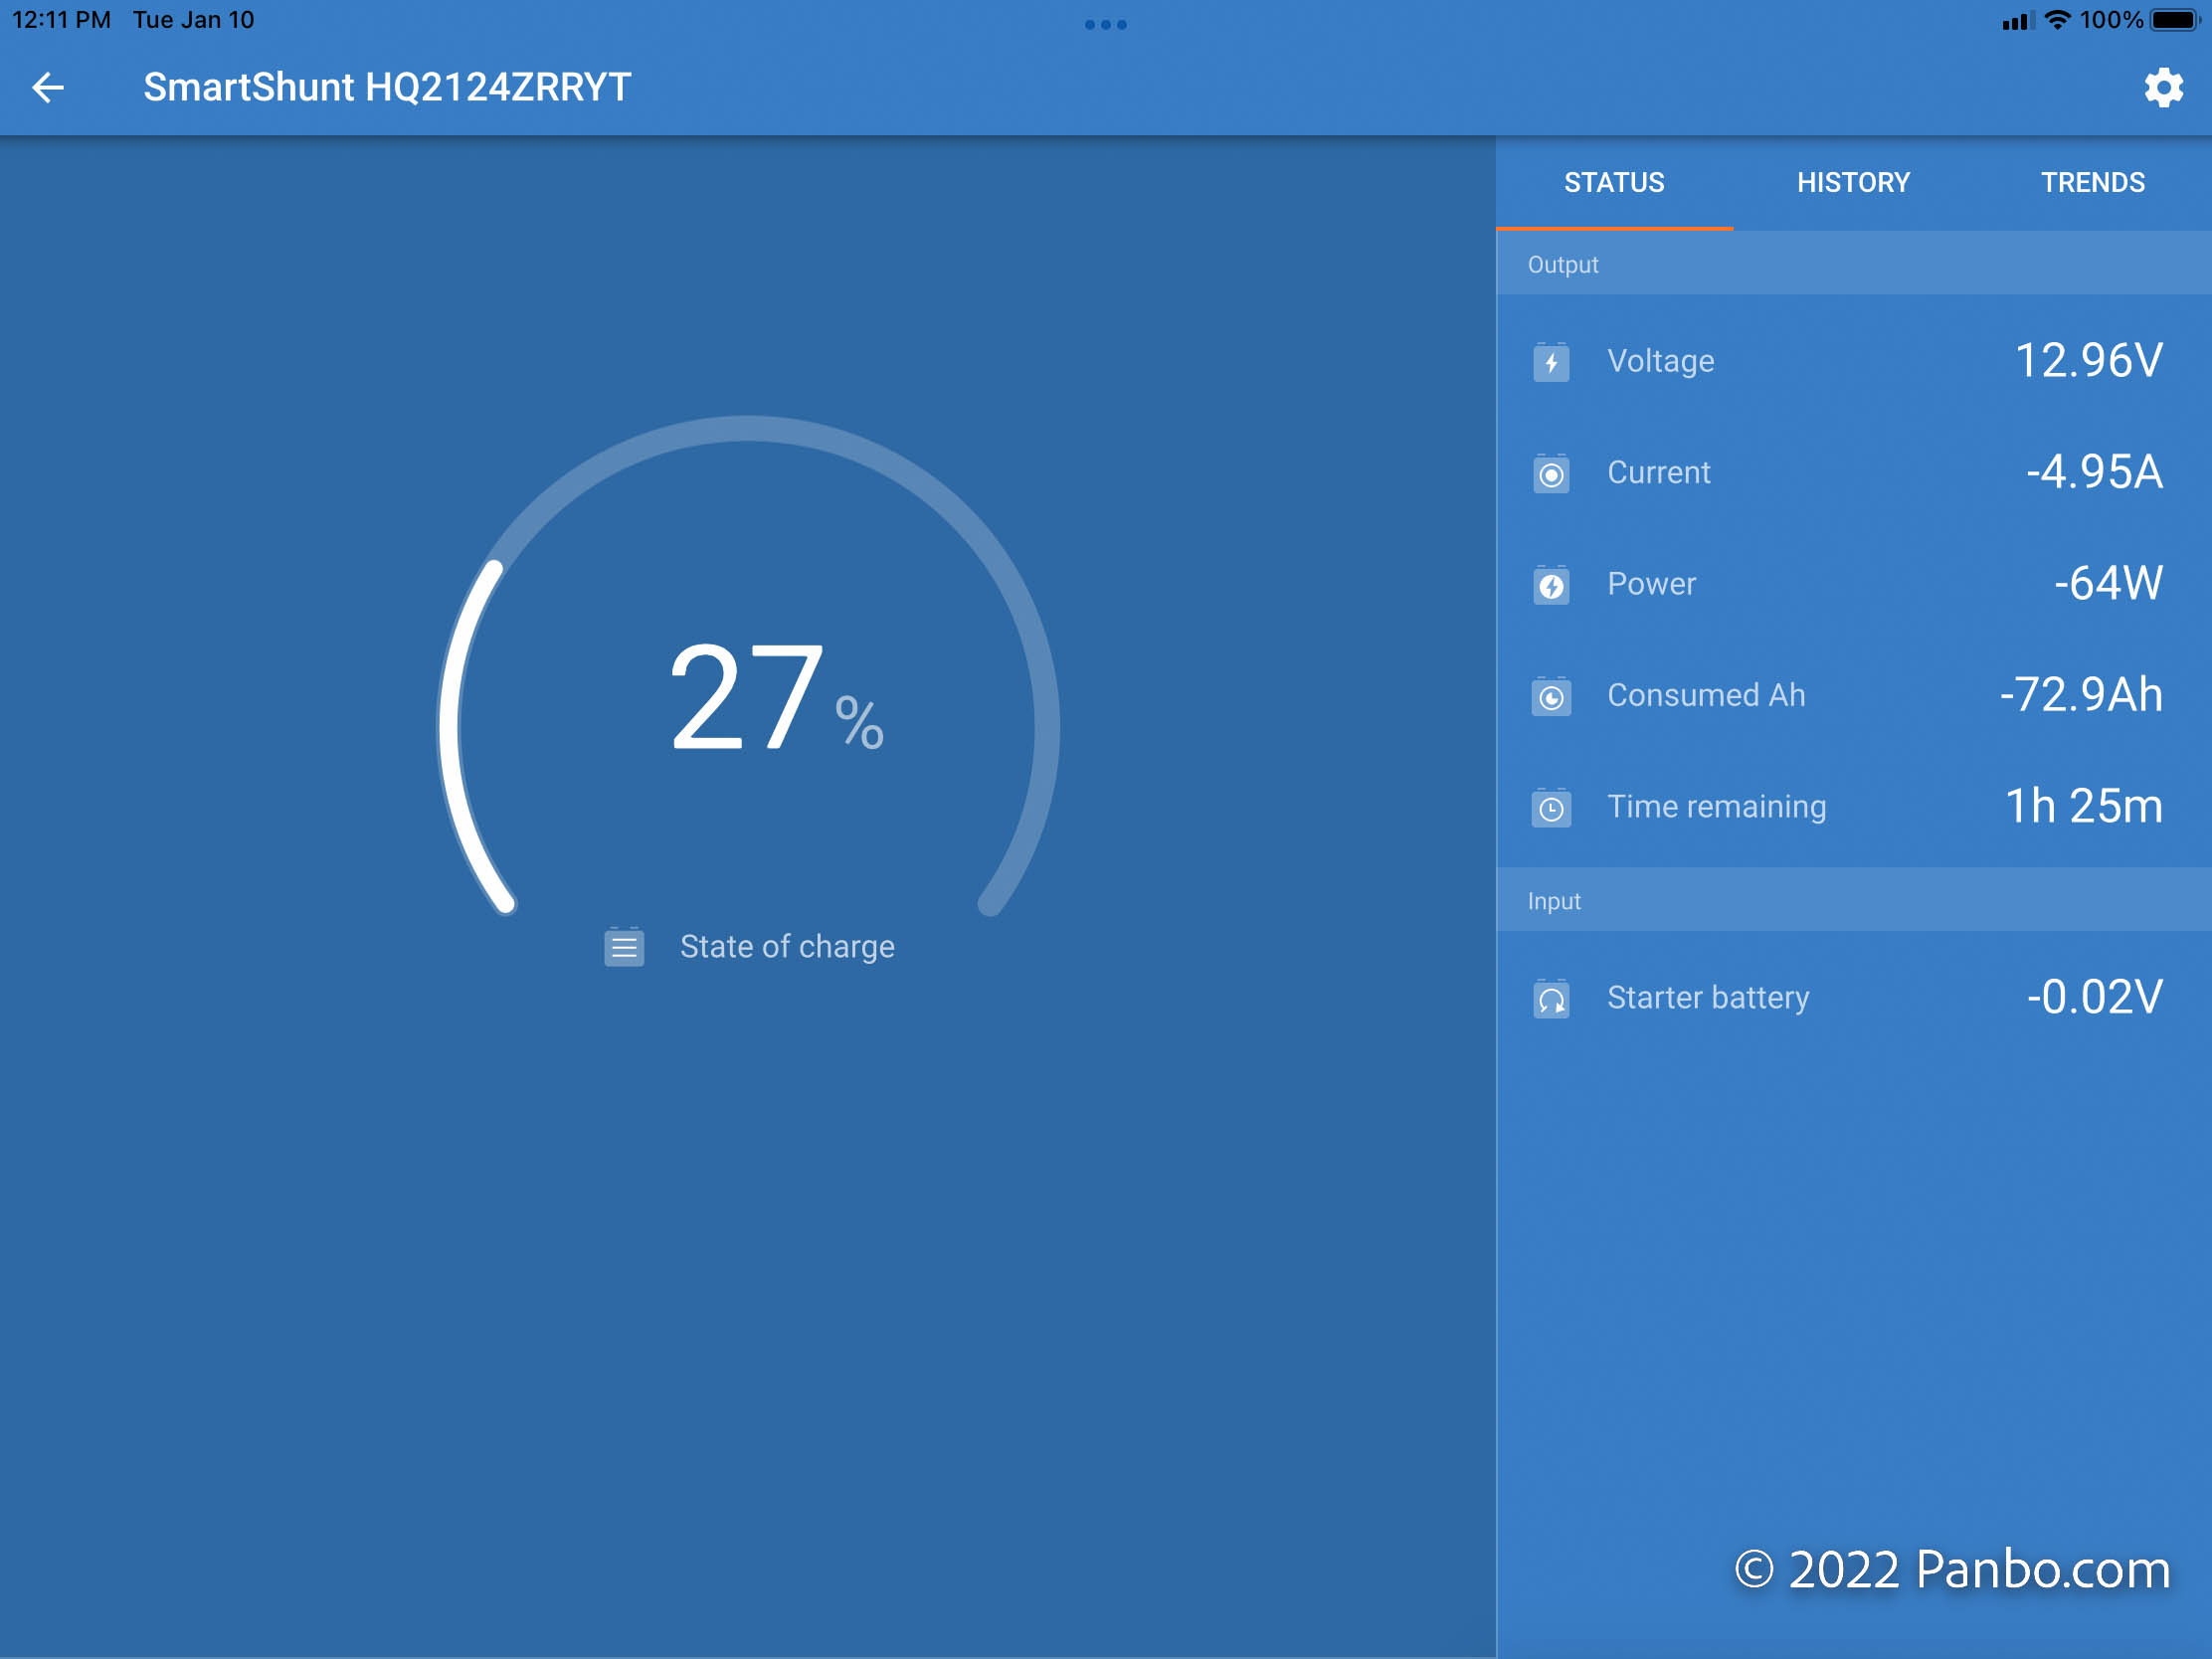
Now that we’ve configured the monitor, its status displays, both on the BMV’s display and in the Victron Connect app, show useful information. Big and bold, Victron Connect shows the battery’s state of charge (SOC) as the first data point. This is the battery’s total state of charge, so if your discharge floor is 50 percent, you will have used all the usable power from the battery when the monitor shows 50 percent SOC.
Voltage, current, and power are all information about the battery’s current status. Voltage is a real-time reading of the battery’s voltage. Current displays the shunt’s measured current flow. Negative current measurements indicate the battery is being discharged, while positive values mean it’s charging. Power, measured in watts, shows how much power is coming into or flowing out of the battery. Power is voltage times current.
Consumed Ah (amp hours) indicates the number of amp hours used from the battery since it was last fully charged. If the battery hasn’t reached full charge in a while, this number can drift. When the charge detection values we set earlier are met, the monitor syncs to 100 percent state of charge. The longer between full charge, the more drift can occur.
Lastly, time remaining shows the battery monitor’s calculated time remaining before reaching the discharge floor.
History
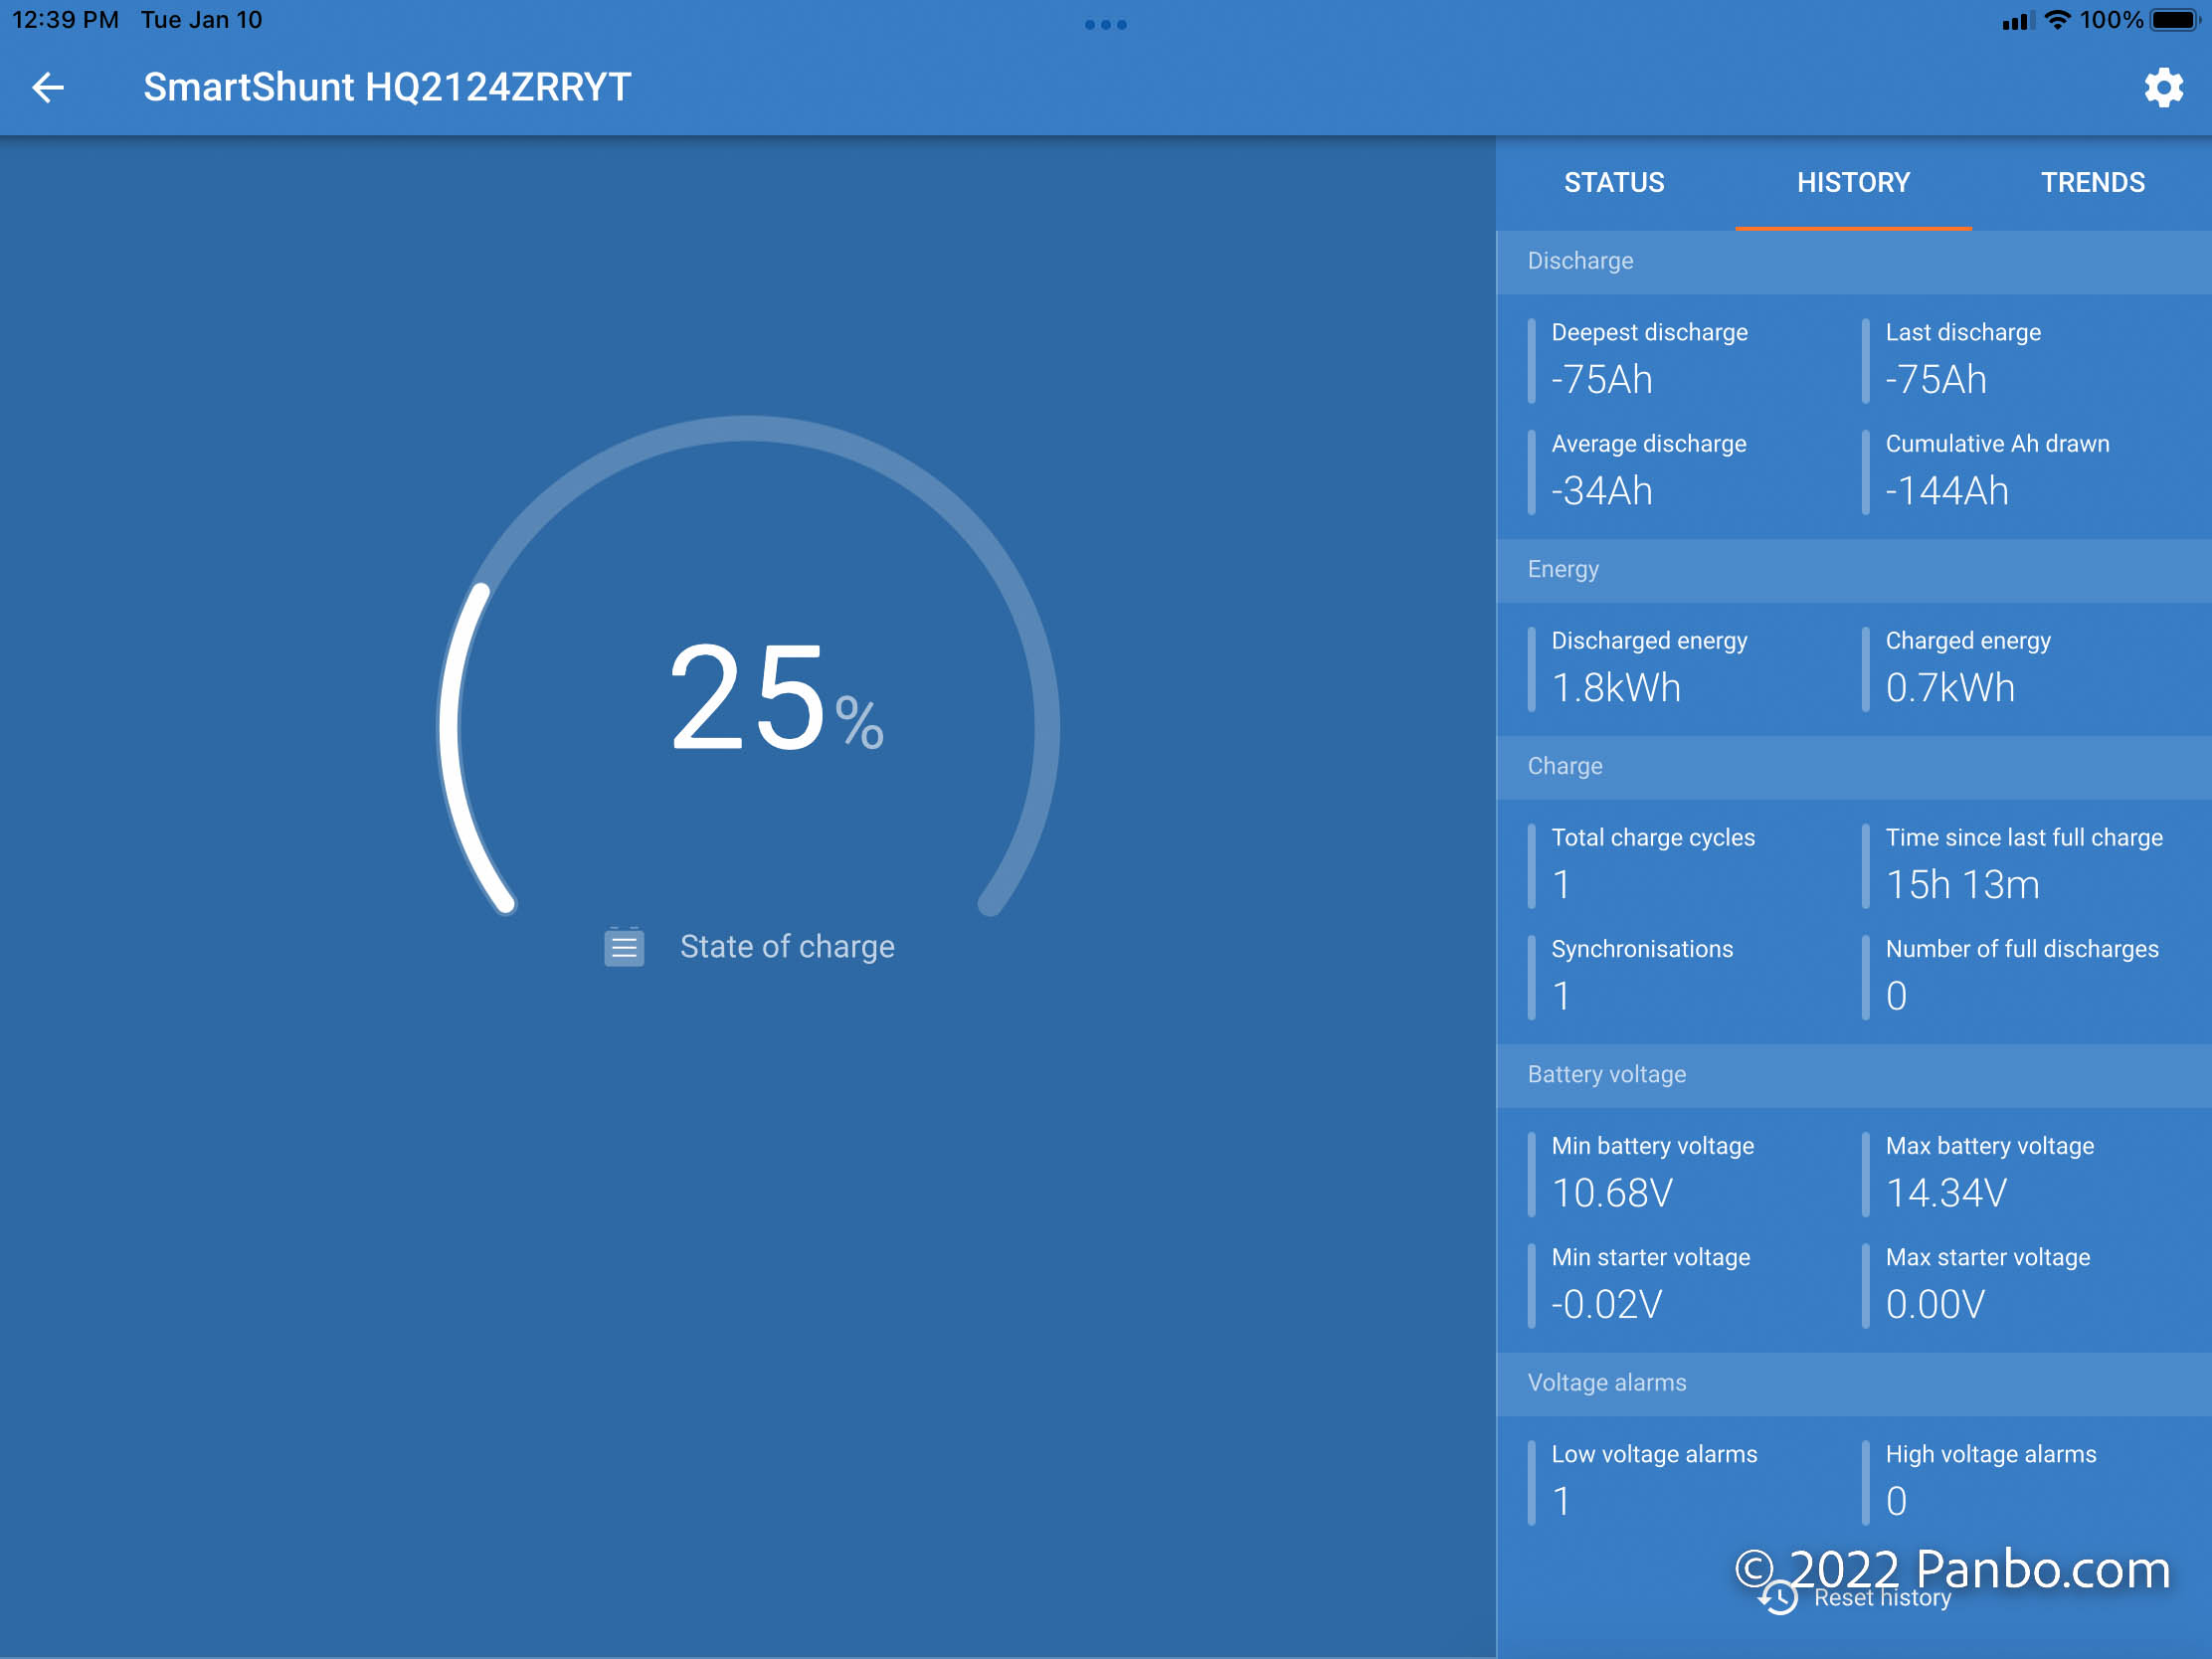
The history tab shows a great deal of useful historical information about the battery since installing the monitor. I’m using a relatively new monitor, so it doesn’t have too much history. When I replace batteries, I also reset the history so I have an accurate “odometer” for the battery. I find Cumulative Ah particularly useful to have a sense of a battery’s lifetime performance.
Victron counts one cycle when a battery dips below 65% and then is charged above 90% SOC. As a result, I’m frequently surprised by the relatively low number of cycles the monitor counts.
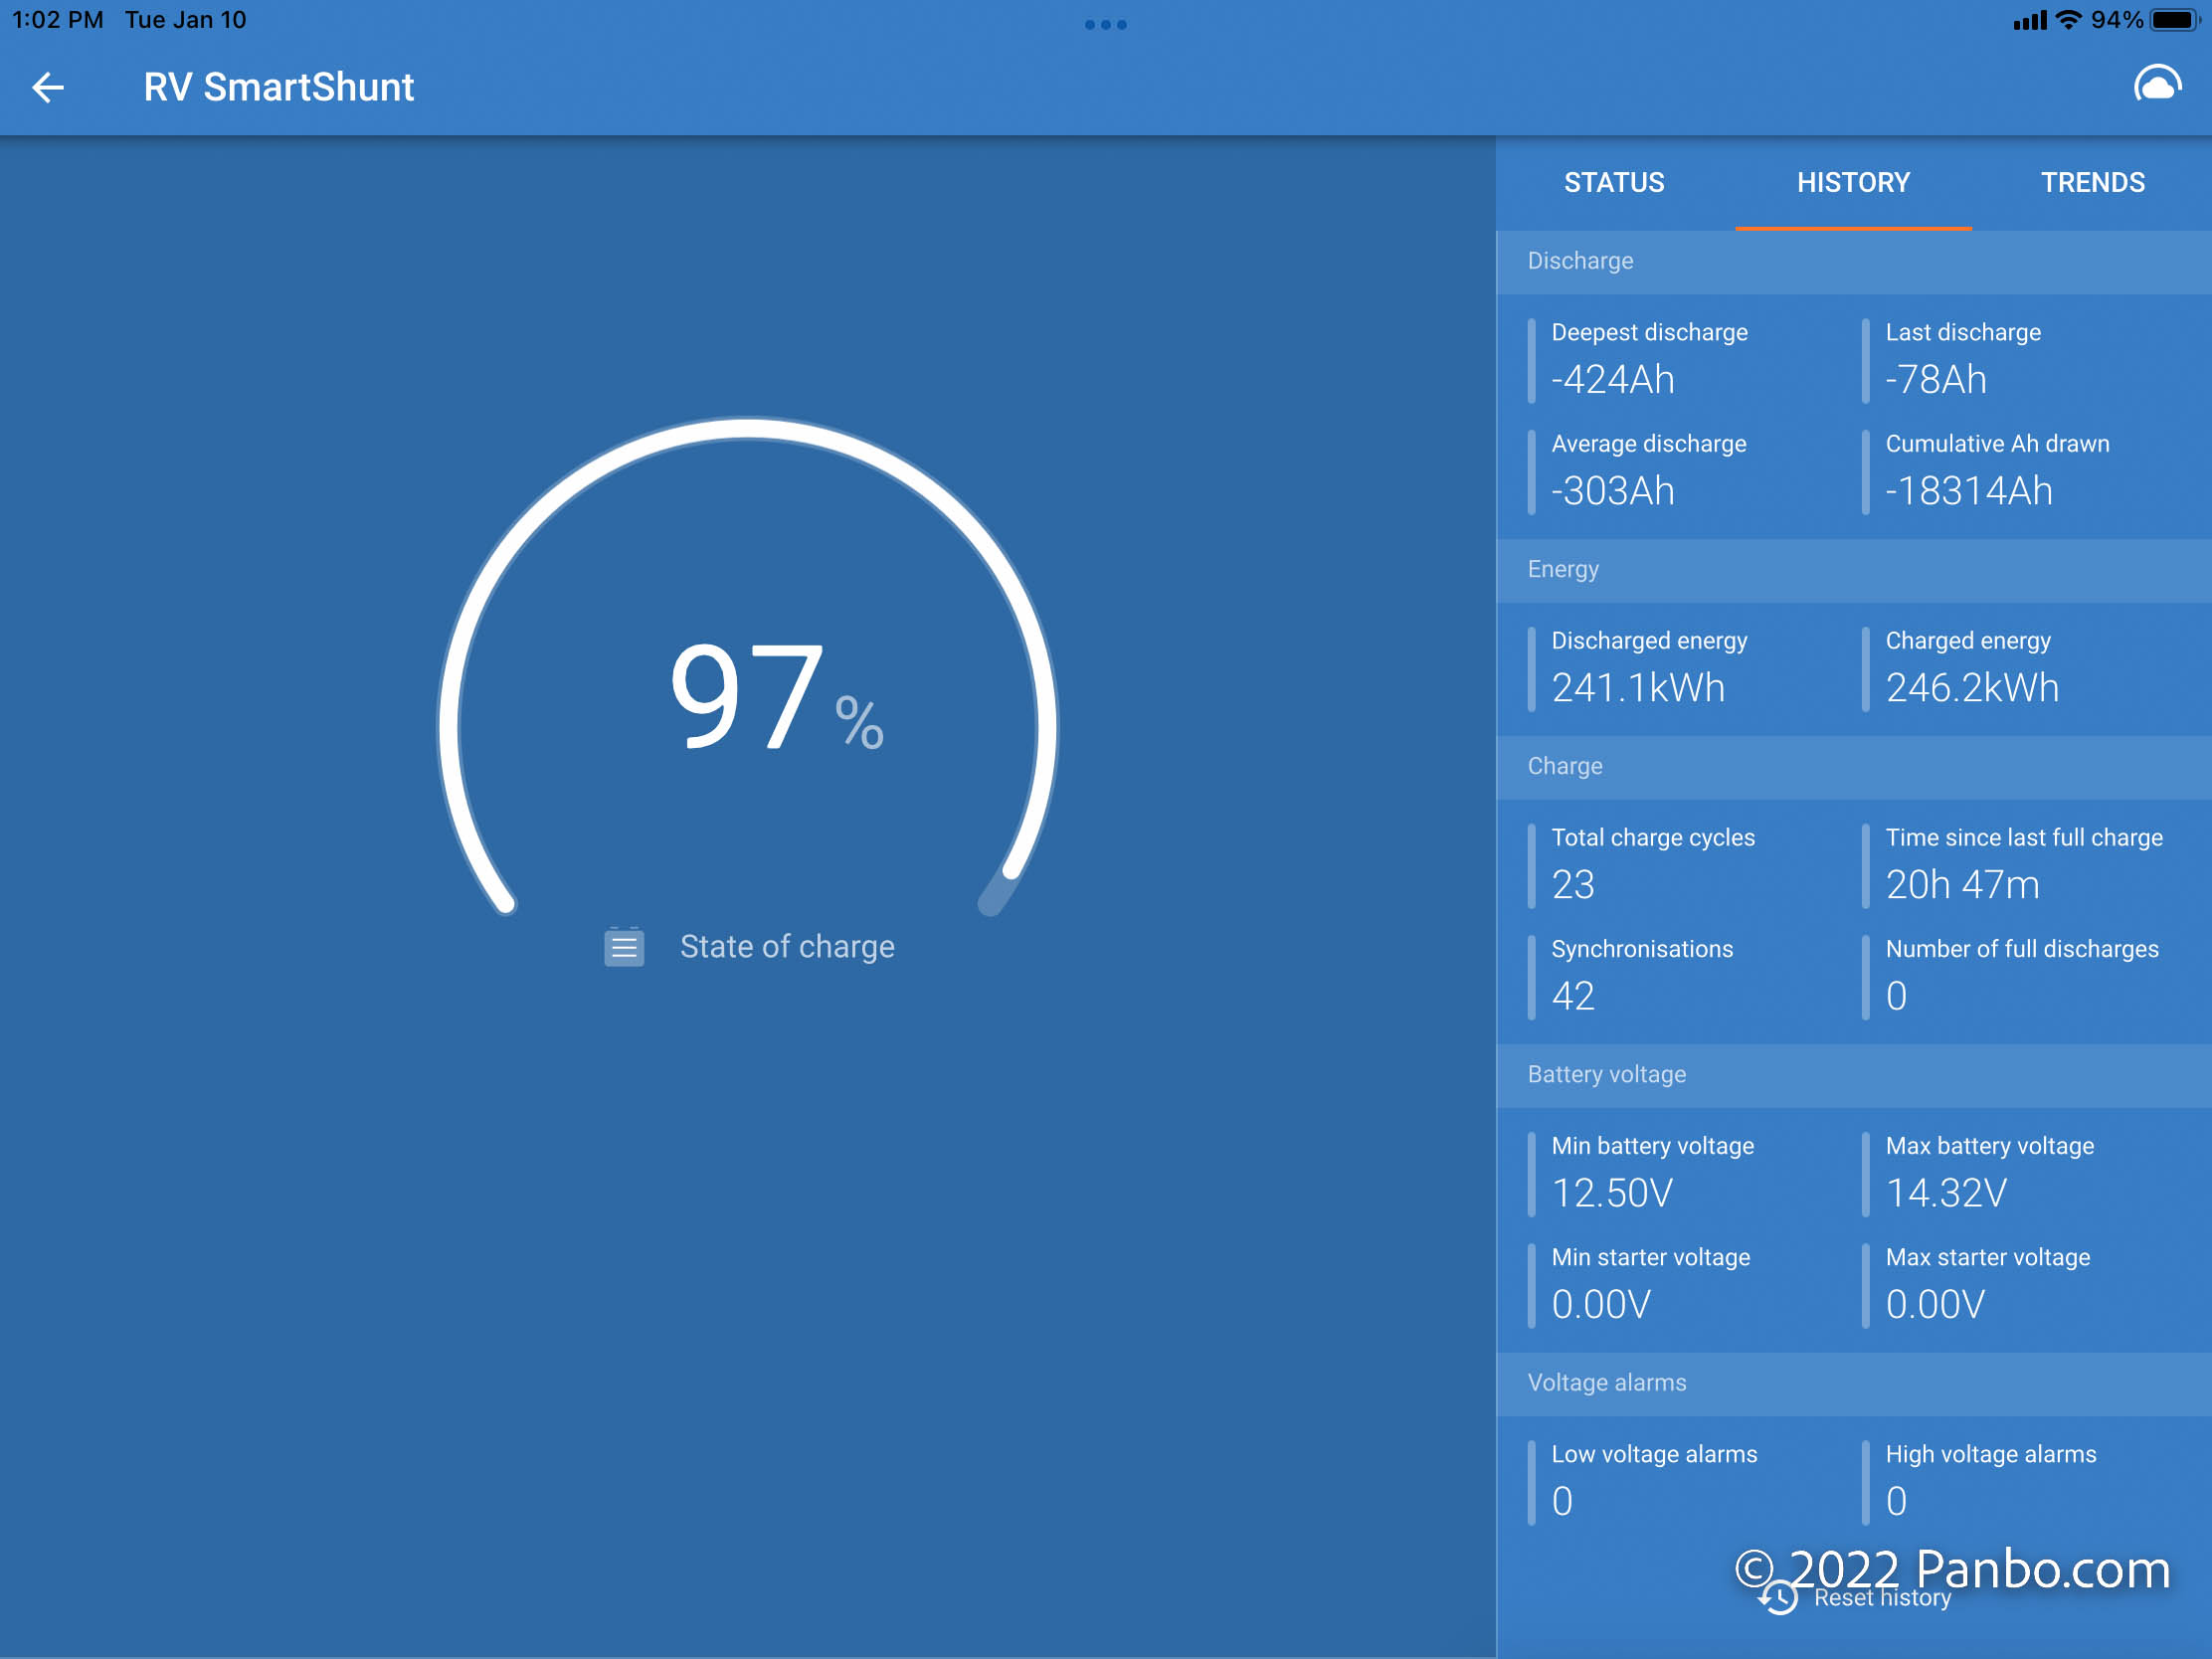
For example, the KiloVault HLX+ batteries I’ve been evaluating show a Cumulative Ah drawn of 18,314 amp hours. That’s from two, 300 amp hour batteries. Thinking about that in battery cycles, that would be just over 30 full cycles. The batteries’ ratings say they should be good for 2,000 cycles at 100 percent depth of discharge. So, the batteries have tons of life left in them.
Alarms
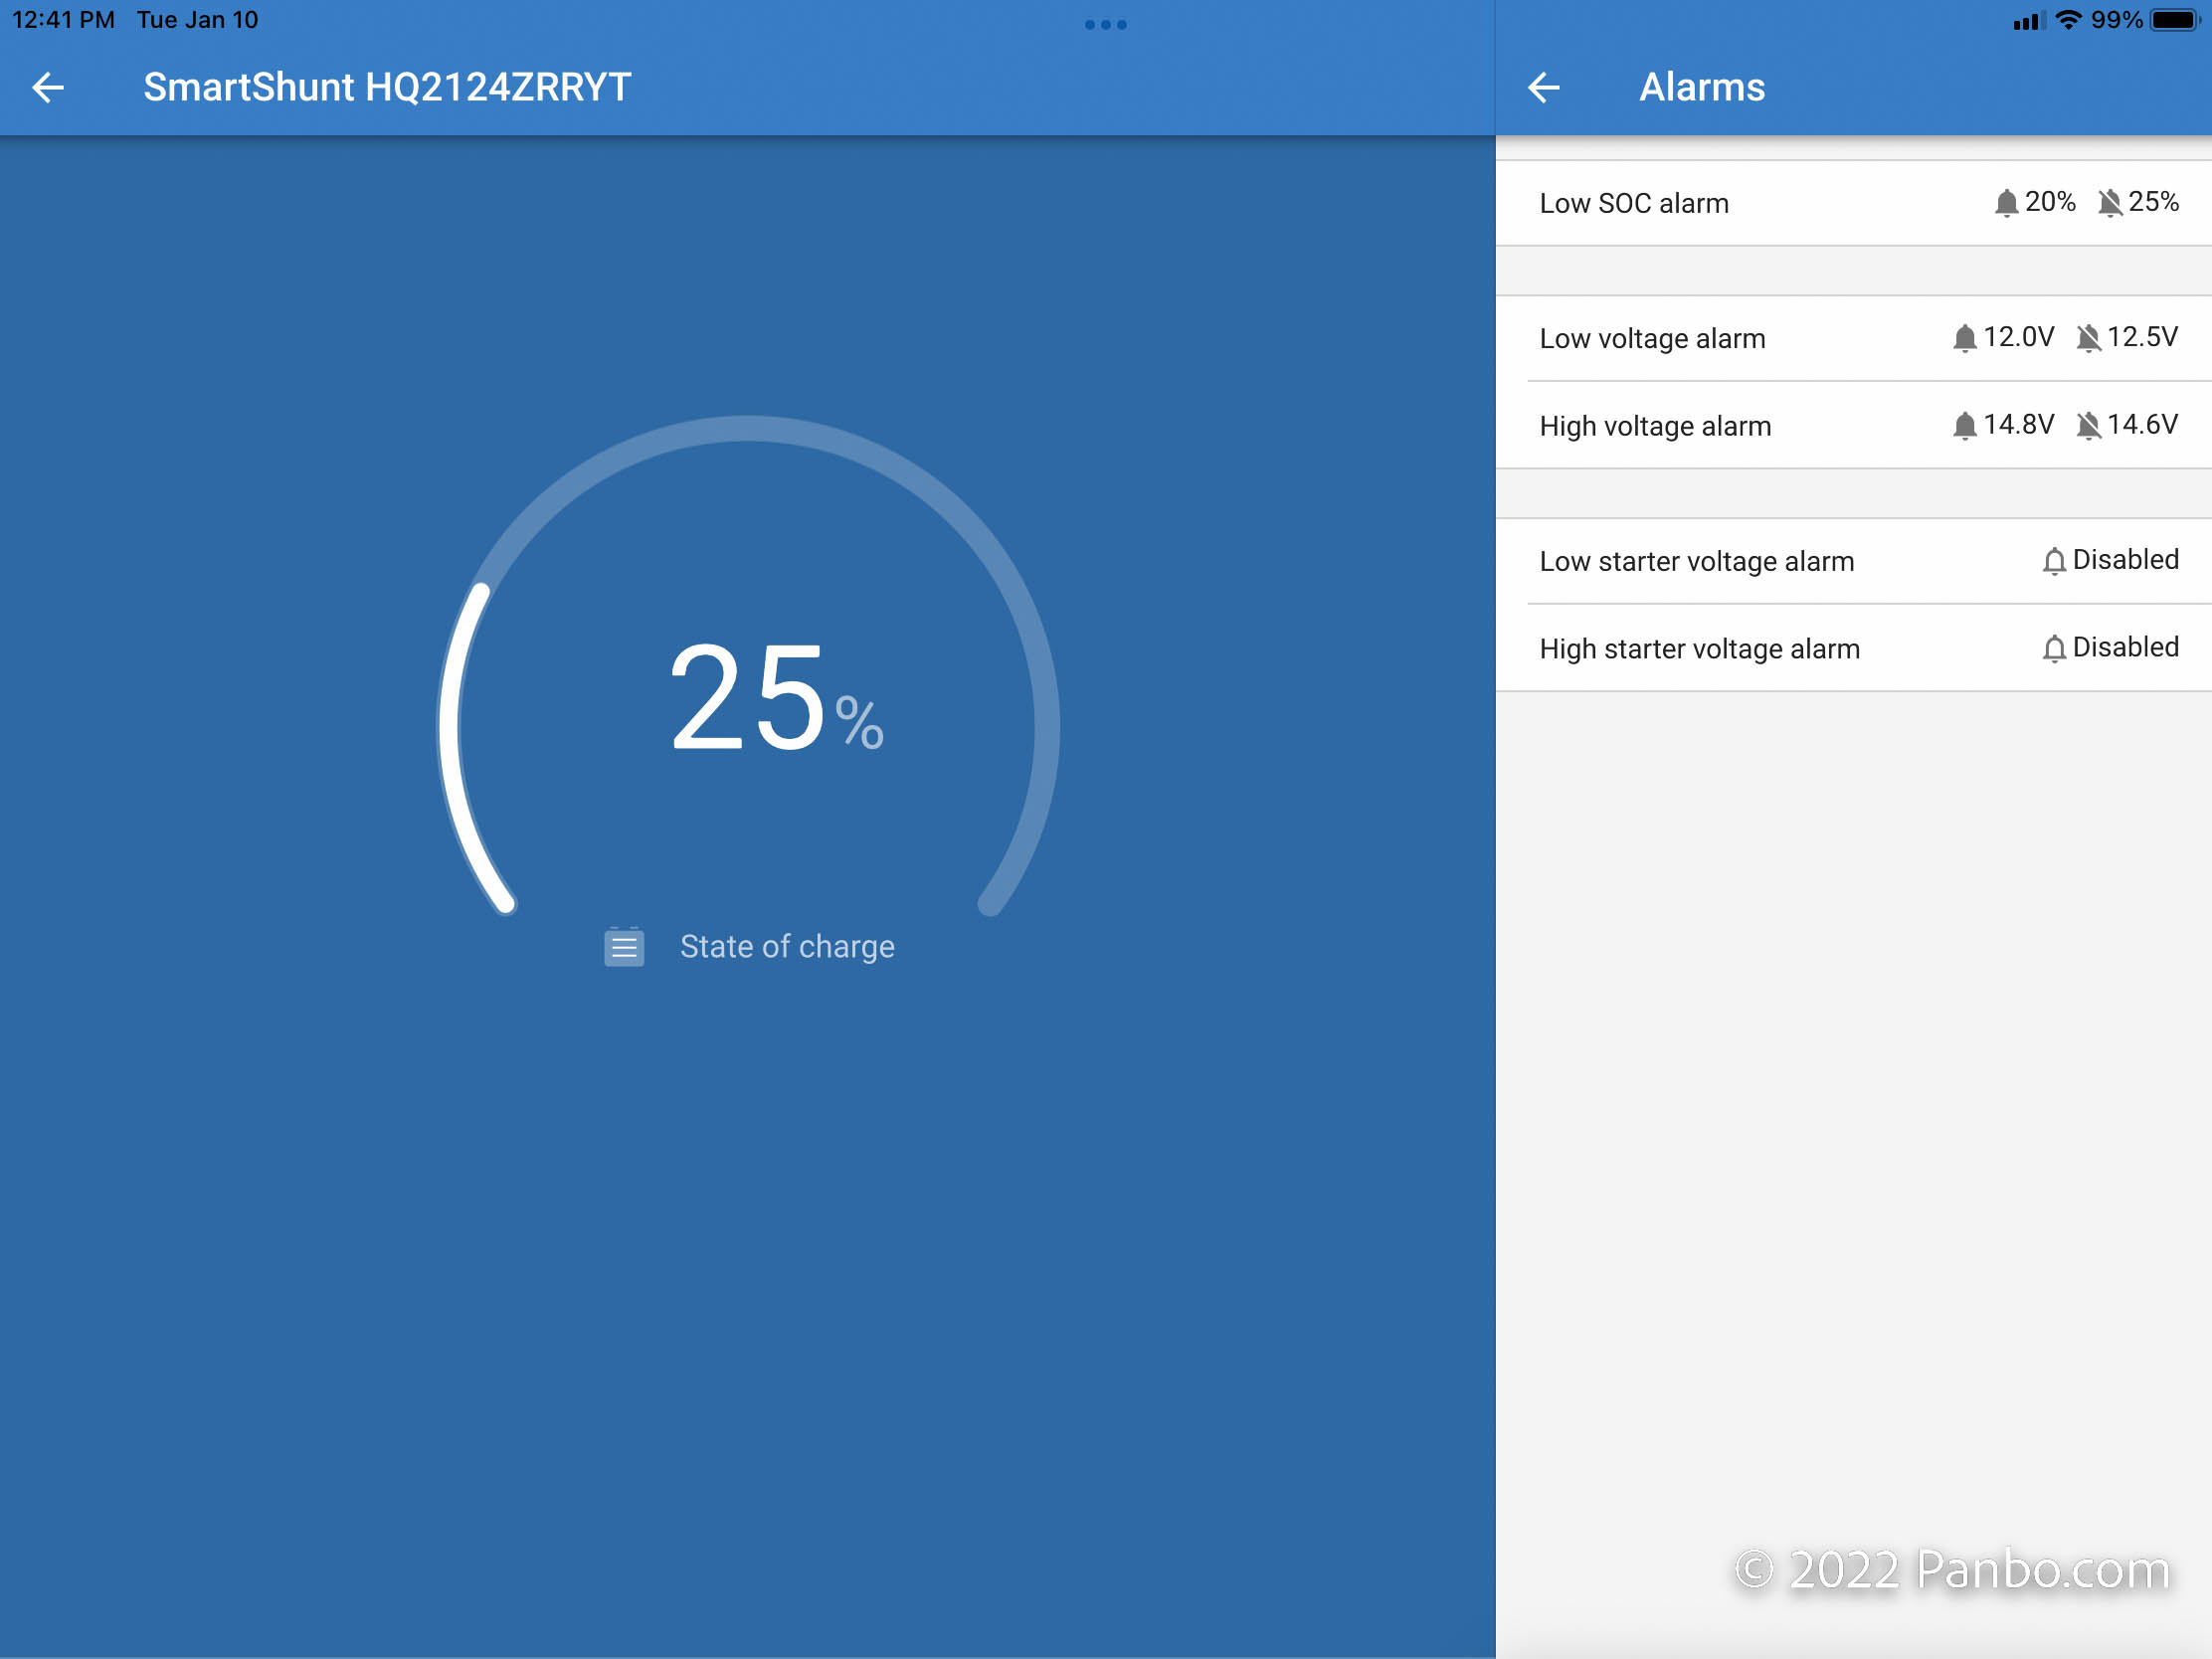
SmartShunts and BMVs both support the configuring of alarms. But, only the BMVs have a buzzer and relays that can take action when an alarm is encountered. SmartShunts will raise the alarm in VictronConnect and can send the alarm to a connect GX device, like a Cerbo, Venus, or Raspberry Pi running Venus OS.
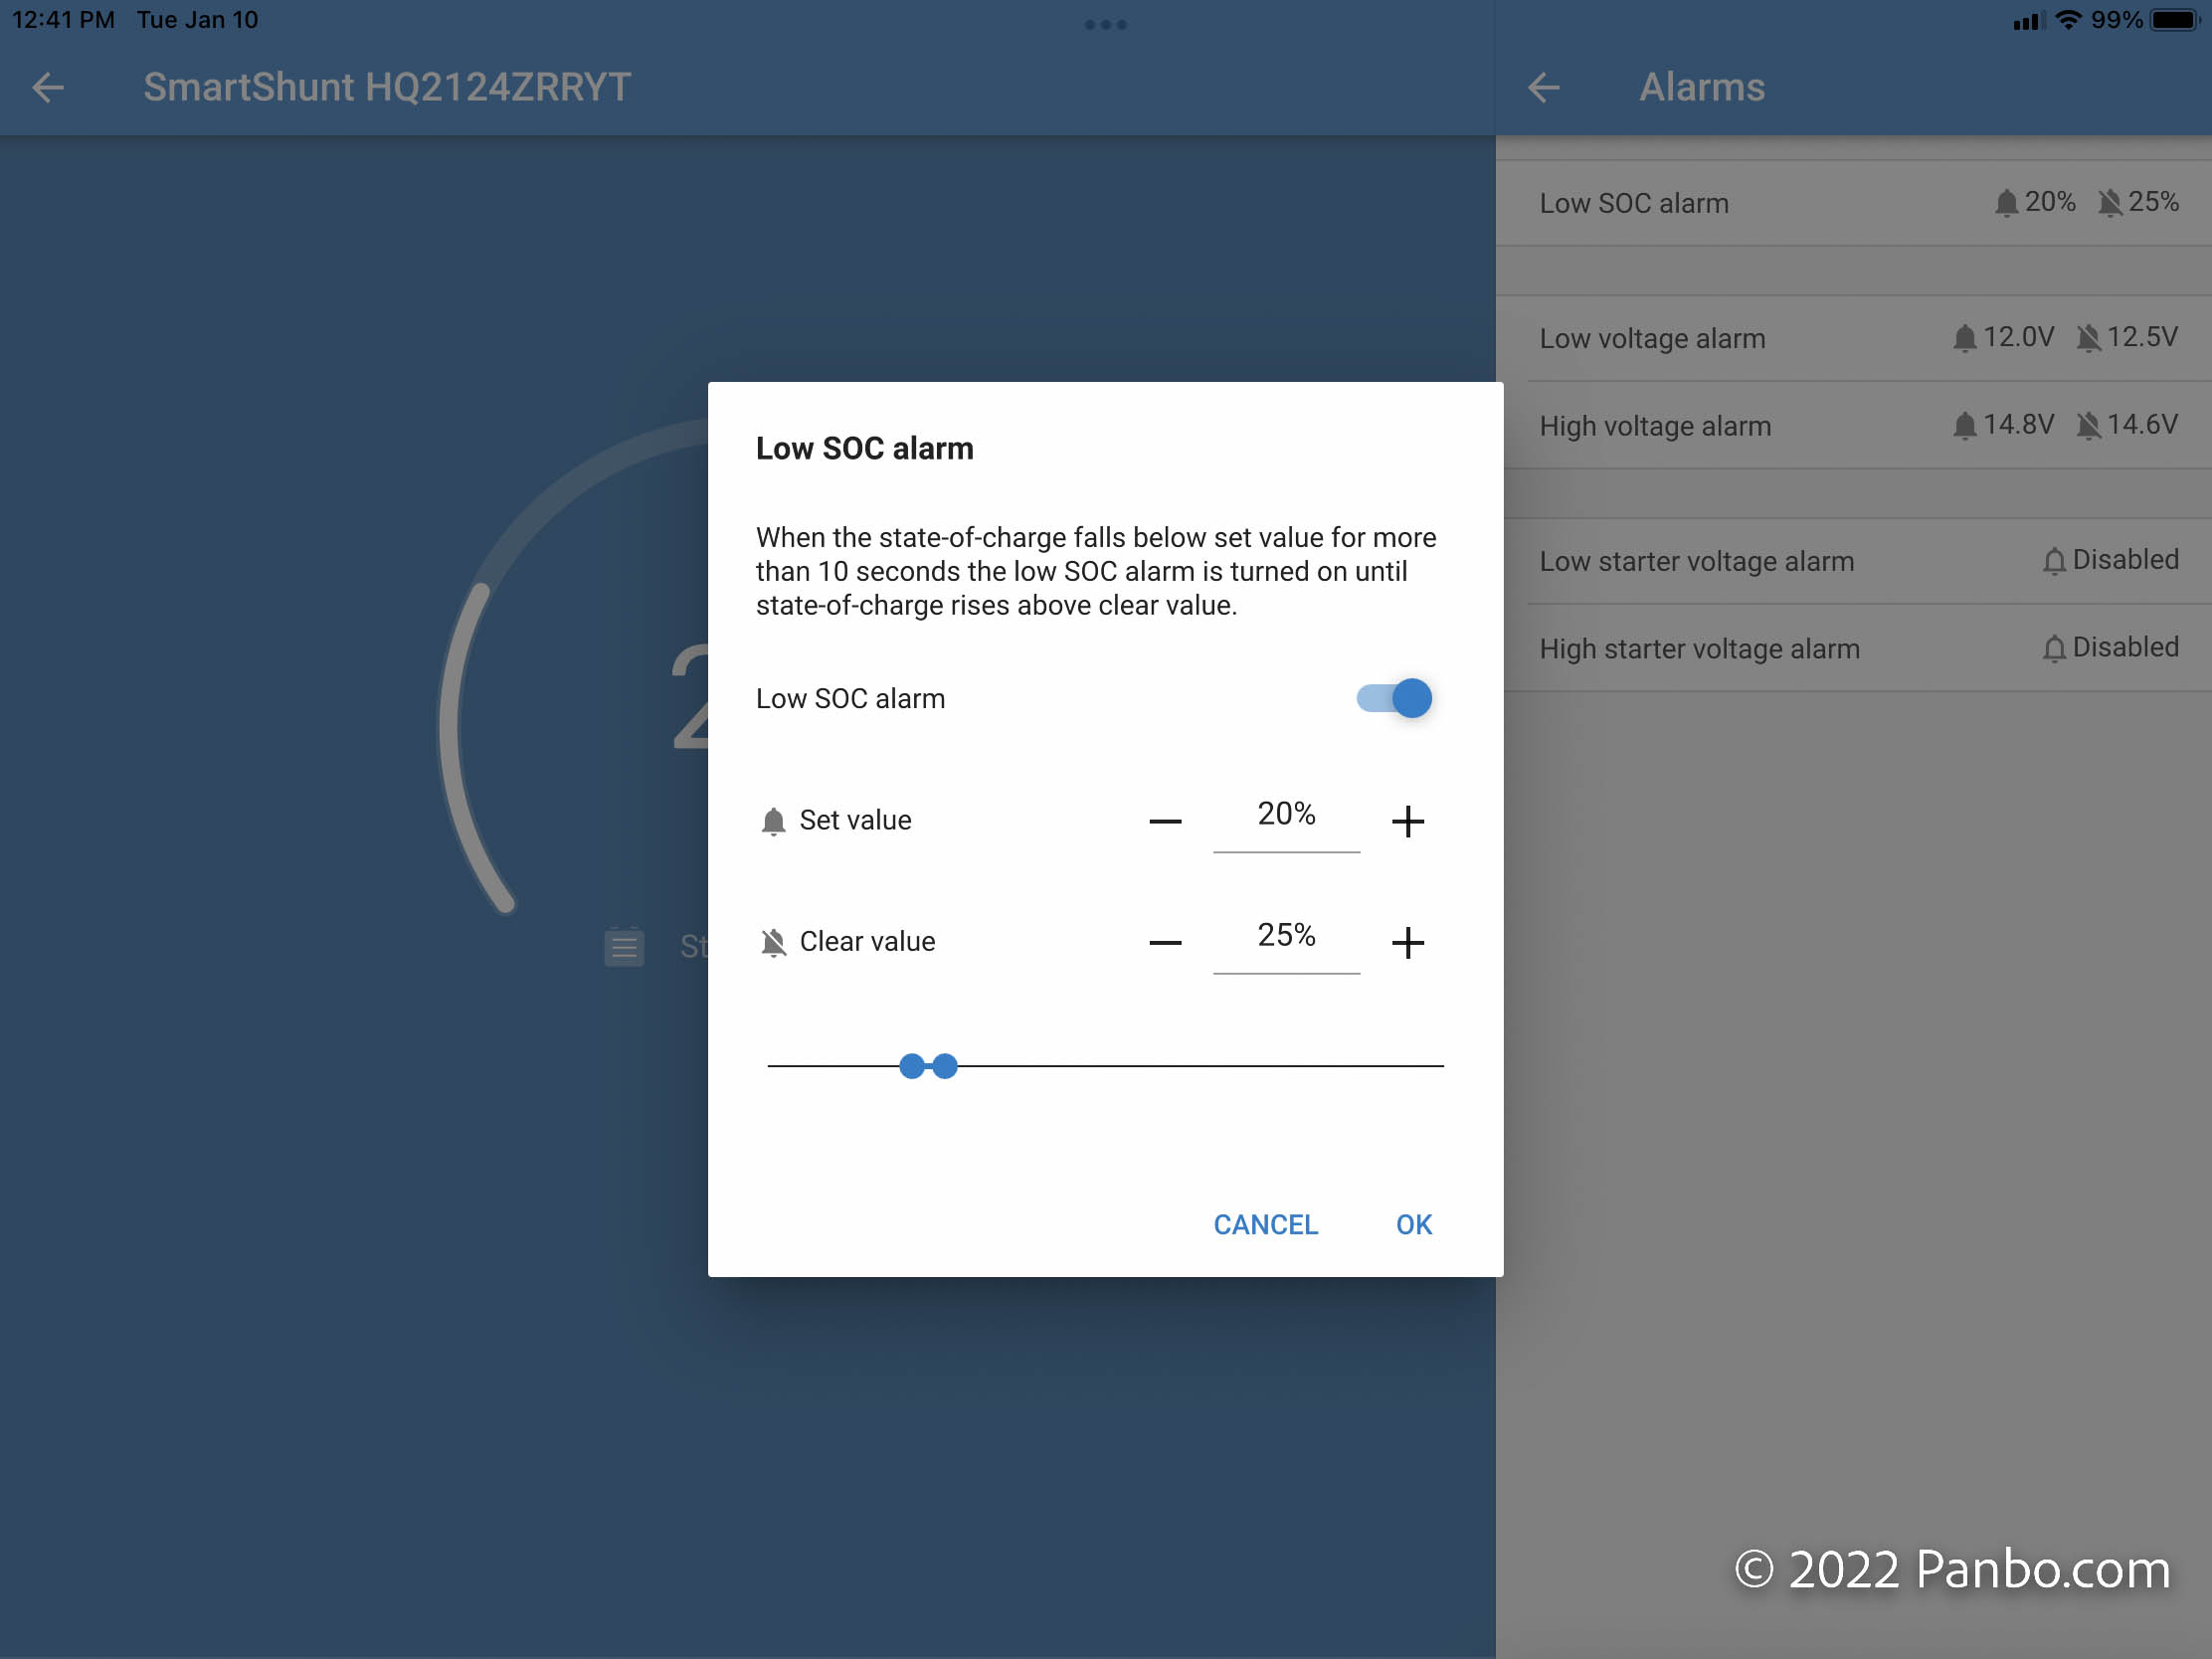
As you can see above, monitors can be configured based on state of charge and battery voltage. SOC alarms are limited to low SOC values while voltage alarms can be configured for high or low voltage. Confiuring alarms is simple. Click on the alarm you want to edit, set the low and high thresholds and hit ok.
Final thoughts
This was going to be a short entry detailing how to quickly configure a Victron battery monitor. Instead, the article is quite long. As it is, I’ve left out detail on lots of the theory behind the monitor as well as some of the additional considerations as you program a monitor. There’s lots more to discuss on the topic and Rodd’s articles linked above do a really good job covering those considerations in much greater depth. If you have questions, please shoot them in the comments below or head over to the forums and ask them there.


I have been extremely happy with the smart shunts on my boat. After converting the entire boat to ChargeX lithium, I installed 3 shunts; one for the stern thruster, one for the 2 battery house and starter bank, and one for the 2 battery bow thruster bank. I connected the starter battery lead to the second battery in each of the 2 battery banks so I am able to monitor each of the 5 batteries individually. The BMS that is built into each battery does an excellent job of balancing charge level. I never see a resting voltage variation of more than 0.02 volts across the 5 batteries. I don’t have a dedicated display but use the bluetooth app on my iPhone. Great product.
Do either of the companies interface with Raymarine?
The short answer is yes!
You will need a Victron GX device to make the connection either with NMEA2000 or running the Victron HTML5 App over ethernet on the Raymarine MFD
Thanks, Peter.
Thank You Ben on a wrap up of major settings and most common source of errors on battery monitoring!
Good article.
I currently have a Victron system including the BMV 712. Having read a number a write up’s of the Balmar SG2000, you gave it a positive review awhile back. I have wondered if the SG2000 might have been a better choice for me?? Also I never quite figured out how to incorporate into the VIctron system. Wouldn’t the Balmar’s self learning provide an easier option as opposed to the Victron calibration requirements?
I am interested in hearing the opinions.
Thanks
Hi Tom,
Unfortunately, I haven’t seen the SG2000’s learning mature in the way I was hoping it would. In terms of integrating into Victron’s ecosystem, I don’t think you’re going to have much luck. There’s a lot of good in the SG2000, but I haven’t seen it all come together as I’d hoped.
-Ben S.
Ok Thanks
This is the most in depth look I have found! Thanks for the great work on this!
Tom, I have an SG2000 installed inline with Victron monitoring on my boat’s lithium ion battery bank, and while the SoC and SoH values aren’t very accurate and it doesn’t count amps hours remaining, I do like the accurate and easy-to-see realtime current and voltage readings. I should also note that Balmar was not certain that it would track SoC and SoH well in my setup.
Also, the MC618 regulator display and configuration that’s part of my SG200 install work well and are very useful:
https://panbo.com/balmar-mc-618-regulator-with-smartlink-integration-first-look/
Since all lead acid based batteries lose capacity over time, how should this be accounted for when using a classic ‘coulomb counter’? If the discharge floor is 50% of rated capacity when new, this means the battery is being over discharged as it ages. How much should the original rated capacity be reduced each year to avoid this?
As I understand it, the Balmar monitor is supposed to do this automatically?
Don,
The best answer I know of is also highly impractical. That is, periodically do a proper 20-hour rundown test to measure the actual capacity. In the real world, it is at best impractical to remove a house bank just to capacity test it. Plus, most boaters lack the tools to do a load test. So, instead, you’re going to be left to infer. With lead acid batteries, I set house capacity below placard capacity on day 1. That helps account for initial capacities that are often below the rated capacities as well as beginning to compensate for some age and use related capacity reductions. Over time, I will drop those numbers by 5 to 10% percent per year.
-Ben S.
Greeting Ben,
Yes, a true capacity test is somewhat impractical. Though, if we had the right piece of test equipment we could leave it overnight (or more) if necessary. Any suggestions on a constant current loading device?
We have been using that same derating factor as well. It leaves our clients a bit uneasy to think they’ve lost as much as half their bank capacity in 5 years. Especially on a light to moderately used battery bank. We recommend that in addition monitoring the daily Ah consumption, they check the voltage as well. Usually in the morning, before a lot of intermittent loads are in use (via inverters for example). A slow decline in voltage at a given Ah SOC seems to be a good indicator the batteries are nearing end of life.
Was I correct in saying the Balmar BMS is supposed to determine remaining capacity in determining the %SOC displayed?
I have been a reader of this blog for many years and consider the level of discourse on par with articles from magazines such as Professional Boatbuilder. Thank you and the other for their continuous effort in delivering top-quality information.
Regards,
Don G.
Don,
I use a Rigol capacity tester as a primary battery capacity tester. It’s designed for use on a test bench and somewhat large. I also have an East Tester ET5410. It’s a cheaper and smaller tester without the same level of precision (and a really painful user interface) but it does a fine job of measuring rough capacity.
Without a purpose built tester, you can use any steady state load, like an incandescent light bulb, and do the math based on the usage of the load. The trouble is it can be tough to get to exactly the 20 hour rate.
-Ben S.
I installed both a Victron charger/inverter and a Victron battery monitor last fall. The company I bought parts from preprogrammed the charger/inverter for me (but I have the USB unit needed to change it myself). I’m wondering if how they programmed it and how I programmed the battery monitor will create any issues. I have a house bank of 4 x 110 amp hr batteries. I also have a 110 ah starting battery, and a 110 ah thruster battery. There are ACRs between the house bank and each of the starting/thruster batteries so that they receive a charge via the charge going to the house bank. When I explained that set up to the company that sold me the Victron, they set the battery capacity to 660 ah. When I set up the capacity for the battery monitor, which is monitoring only the house bank, I set it to 440 ah. Any issue with that inconsistency between the charger/inverter and the battery monitor? Anyone think the charger/inverter capacity should be set at 440 amp hrs?
I think you must have a Quattro inverter/charger – at least that’s the only model of Victron inverter/charger I could find that seems to offer a “battery monitor” function, with associated battery capacity setting. The inverter/charger uses this to provide a rudimentary State-of-Charge (SOC) value for the bank – but if you have an installed Battery Monitor, it is my understanding that the various systems that use or display SOC will ignore the value from the inverter/charger and utilize the one from the battery monitor instead as it is much more reliable. (At least my Cerbo GX instruction book says that 🙂 ) My feeling is that you could turn the battery monitor feature in your inverter/charger off – but I will defer to others who might have direct knowledge!
Thanks for that suggestion, Harley. My inverter is the Multiplus 2, but I think it is like the Quattro in that it has an internal SOC value. But not a great one. I think that setting is off. I will double check. But it might explain why the Victron dealer programmed it as they did. I appreciate your post. Thanks.
Ben…..excellent explanation.
I did not see any explanation of the charge efficiency factor ??
I figured it the hard way but this verified my understanding… I have the a 900 amp bank of Kilovault HLX batteries and one test I did was set the charged voltage very high so the shunt did not reset and then subjected the batteries to 4-5 days of the same load cycles.
Monitoring the shunt voltages and current, I could easily observe the accelerated voltage ramp from ~13.6v up to ~14.1v and the current fall off at the same time so I know they were full each day.
What I could then observe was the SOC state (calculation) cycling and declining each day about 5-6%
I then adjusted the peukert exponent and the charge efficiency factor to optimize this response. It is not perfect but it is now 2-3%
Together, these two constants affect the calculated SOC decline and recovery slopes (if I understand correctly).
Paul,
I’ve noticed the same using Victron Smart LFP, seems like Peukert value of 1.05 is not precise enough. Instead of playing with Peukert value, I set up charged voltage back down to 14.2, now Smartshunt resets itself to 100% correctly.
Can I monitor two different sized lithium batteries with one battery monitor ?
Typically, a battery bank should be composed of matching batteries. The batteries should match in terms of size, brand, and age. Each battery monitor can only monitor one bank for current, though voltage of a second bank can be monitored.
-Ben S.