
MTA: So what are electronics buyers investing in?
Last week Marine Technology Advisors (MTA) began publishing more results of the 2010 survey. This is the second installment: Among a long list of market characteristics MTA tested for – and will be testing again – was the current rate of installation for more than 60 technical segments. We asked survey respondents to cite their current position with these marine technologies in one of the four states diagrammed below. What we found was a electronics market with a broad range of market development maturity across more than 60 technical segments. Can buyers and suppliers enhance their relationship(s) by thinking about their solutions from this perspective? Can users and suppliers of materially different technical solutions benefit from common market development strategies? We think so…
A Worthwhile Way To Organize A Highly Fragmented Market?
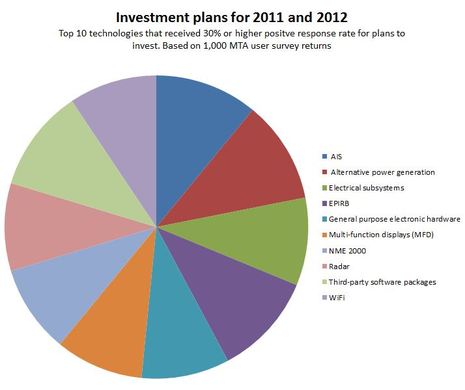
Lets see if this framework is instructive. We will take a look at three sets of technical segment opportunities in the recreational marine electronics market – based on 1,000 MTA user survey returns. The technical segments presented here are a subset of the more than 60 technologies MTA tested in its last survey. These are the top ten technologies that received 30% or higher positive response rate for plans to invest in these technologies during 2011 or 2012 (alphabetical order):
1. AIS
2. Alternative power generation
3. Electrical subsystems
4. EPIRB
5. General purpose electronic hardware
6. Multi-function displays (MFD)
7. NME 2000
8. Radar
9. Third-party software packages
10. WiFi
Pretty interesting when you think 1,000 highly qualified private vessel owners and operators invested 20 minutes of their lives to complete this survey. (They were rewarded with a contribution to two global charities.) These were the top ten most often cited planned investments for survey respondents. Obviously there are any number of logical next steps to analyze these opportunities:
- Demographics of users that cited these technologies – and demographics of those that did not – homing in on the core market
- Product selection criteria for these technologies – honing the market messages
- Vendor and source selection criteria for these technologies – channeling resources
The MTA recreational user database has this information…
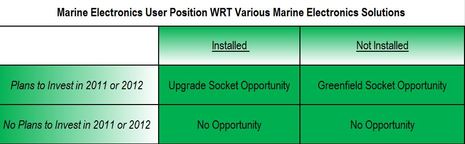
Takeaway: Different Segments, Different Penetration/ Maturity Levels, Different Strategies
But, what about a different, perhaps equally valuable framework for considering these technologies. A framework that might aid buyers, suppliers and resellers? Lets try.
Upgrade Sockets – These are the technical segments where the highest share of respondents planning to invest already have the solution currently installed. Legacy integration – mechanical, electrical, electronic – matters. Users’ visceral experience with the installed base of systems matters too.
Greenfield Sockets – These are the technical segments where the highest share of respondents planning to invest do NOT have the solution currently installed. A significant amount of market education and training may be required with these solutions. A number of likely unforeseen enabling technology upgrades matter, too.
Mixed Sockets – Technical segments with high rate of investment planned, and a high rate of mix between those with solutions already installed (Upgrade Sockets) and not installed (Greenfield Sockets). Well, as you might guess, combinations of both conditions above, existing in every imaginable mix.
Approximately 36% of survey respondents cited they would be investing in the following technologies:
1. Third-party packaged software
2. Alternative power generation subsystems
3. EPIRB
One of these markets is Greenfield with 74% of those investing for the first time. Another is Upgrade with 70% investing in installed systems. The third is a Mixed market, with a 45% upgrade/ 55% new install mix. Can you guess which is which?


Ben,
Deconstructing the pie chart gives the following: approximate information.
AIS=10.8%
Alternative power generation=10.8%
Electrical subsystems=10.8%
EPIRB=10.6%
General purpose electronic hardware=9.9%
Multi-function displays [MFD]=9.6%
NMEA 2000=9.5%
Radar=9.4%
Third-party software packages=9.3%
WiFi=9.3%
This means there is a 14% spread between the largest and the smallest segments–not much differentiation based on consumer spending plans.
There is a noticeable break between EPIRB and GPEH however, it is barely one standard deviation, and so it may be a distinction without difference.
If this were a company portfolio of lines of business, from what I see here, I would ditch WiFi and Third Party Software as lines of business, but not because of their spending predictions.
WiFi is too easily jerked around by large provider decisions and the business model is still ugly for the non-business user who has no one to pass costs on to. Smartphones are also a disruptive technology where WiFi is concerned. A year of unlimited data via cellular can still cost about the same as the marina-days of paid WiFi associated with a year on the water and offers better security. If one needs the cellular data plan anyway, why mess with WiFi? Also, margins here don’t look so hot (unless you are providing a paid WiFi hot-spot which is a cash cow).
Third party software (almost) always has great margins, sometimes well into the 90% range, but here, good enough is good enough and feature creep is delivering increasingly complex and complicated solutions. Also smartphones and apps are a disruptive technology that would make me quite leery of investing in another mega-suite PC/MAC based package for boat owners. Clearly, there are some harvestable niches, particularly those enabled by NMEA 2000 data flows, but as soon as NMEA starts porting reliably to smartphones, I suspect Apps on Tablets (the new MFD?) will rule.
Just some thoughts. I’m a data junkie…
This is strange, no mention of the thermal imaging camera? I wonder what value FLIR saw in Raymarine and if thermal cameras will ever be in the top 10 technologies found on a pleasure boats? I attended a Raymarine function at a boat show and remember reading an article where FLIR were convinced that Thermal Imaging cameras would fit between GPS Plotters and sounders as a must have on every boat so that’s why I find it strange that even WiFi and 3rd part navigation software makes the list ahead of night vision? Do you think the FLIR guys know something we don’t?
I’m not sure what all the fuss is about WiFi. I purchased an Ericsson W25 with a marine antenna and I have great WiFi connectivity on my boat. I’m connected to 3G data on my laptop, smartphone and iPad, no problem. The data card is an addition to my cell phone account and I get a few Gigs of data for $10 a month. I’ve been running a demo version of maxSea Time Zero and downloading weather files, surfing the internet, logging into muy company server, Skype etc….it’s great! There is also a very good 3G booster manufactured by Quantel: http://www.quantel.co.nz/quantel-boosters.html
As a prior participant in the survey, where can we go to see the definitions of these areas (e.g. Alternative Power subsystems vs. Electrical Sub systems vs. general purpose electronic sub systems )?
John, I am considering the W35 and just now learned about the Shakespeare Cruise Net Cn-1200-A (for ATT).
Street price of the W35 is $350 vs. Shakespeare $1200
What kind of range do you see with the Ericsson when offshore? Thanks, Ronald
That pie-chart looks like all divisions are equal. That makes me wonder if there is any statistical significance to the survey answers.
Hi Bremer, I received my WiFi advice from a friend who is the superintendent for an offshore supply company who run a dozen support tugs out of the NW coast of Australia. He said that the W35 has terrible connectors and it overheats so they swopped all their WiFi W35 routers out for the W25’s. I just followed his advice and also installed a CDMA whip antenna manufactured by ZCG (model AN1600). I do not sail too far off the coast so I’ve never been without coverage when I’ve needed it but I think the commercial users get pretty far from the nearest tower. I will ask the question and post his reply here.
Good morning PANBO.
Christopher and Jim Hebert are correct to call into question the significance of the chart.
The technologies listed are the 10 technologies with the highest rate of citation for expected investment in 2011 or 2012. That is accurate.
However, the data shown is not the number of respondents who stated that they would be investing. The data shown is the total number of respondents to the question — regardless of their answer. And the survey produced somewhere between 747 at the low end and 857 at the high end. This is a simple of case of charting the wrong column (total respondents to the question) not the correct column (only respondents stating they will be investing).
The more powerful data would have been to show the number of respondents that cited they would be investing in each technology. In that case, you would see a very different pie chart, and a much broader range of ‘divisions’.
Among the top ten technologies most often cited for investment in 2011 and 2012:
1. The #1 most often cited: 55.8% of 802 or 439
2. The #10 most often cited: 29.3% of 747 or 219
Thank you to both of you for pointing this out.
With an average of 800 total respondents for each of these top ten technologies, we think the data is a pretty solid.
We hope you agree. Thank you.
Good morning PANBO.
John asked about thermal imaging.
We tested for more than 60 different marine electronics technologies. This post shows only the top ten most often cited for investment by the survey respondents.
Thermal imaging was not among the top ten.
Where was it? About 2/3 of the way down the list with 19% stating they would be investing in thermal imaging solutions in 2011 or 2012. While 19% may seem a little low, approximately 90% of those buyers were not currently operating thermal imaging.
Thermal imaging looks like a smaller, but we think rapidly growing market segment.
Regarding FLIR’s acquisition of Raymarine: MTA’s condensed view is that while strong thermal imaging growth looks likely, we think the deal was probably as much about FLIR expanding its technical footprint with Raymarine offerings as it was expanding FLIR’s served available market (SAM) for its thermal imaging offerings.
Thank you.
Good morning PANBO.
Dan asked for some definitions. Here you go:
1. Alternative power subsystems examples include fuel cells, solar cells, wind microturbines
2. Electrical subsystems examples include power supplies, UPS, transformers, inverters, converters, switches, relays
3. General purpose electronic systems examples include marine application optimized servers, storage, switches
Hope this helps. If you would like more, please email [email protected]
Thank you.