
SiriusXM and Garmin GXM 54 add Fish Mapping to satellite weather
SiruisXM has expanded on their satellite delivered weather options with their new Fish Mapping plan for anglers. Does Fish Mapping deliver the goods for the offshore angler? With sea temperature, plankton, weed line, sea surface height and fishing recommendations there’s a lot of data to help you find fish and Garmin makes it easy to display on their MFDs.
Hardware
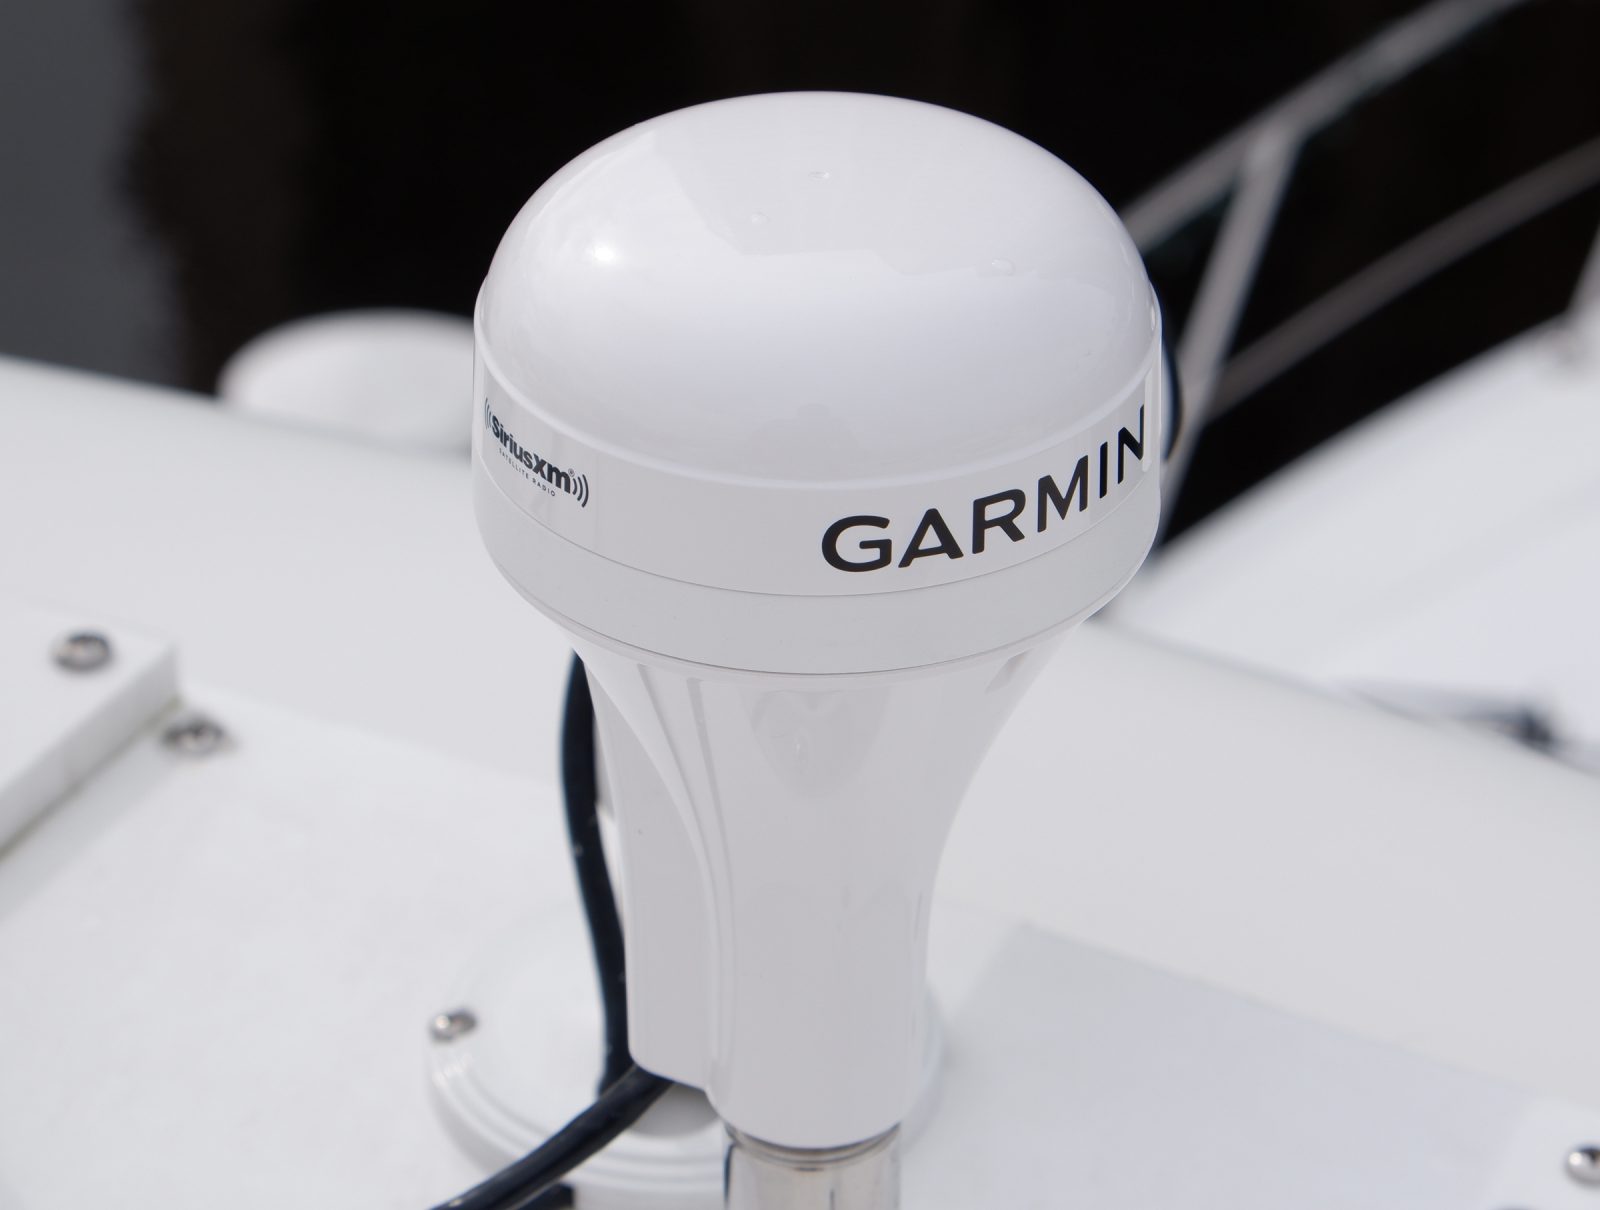
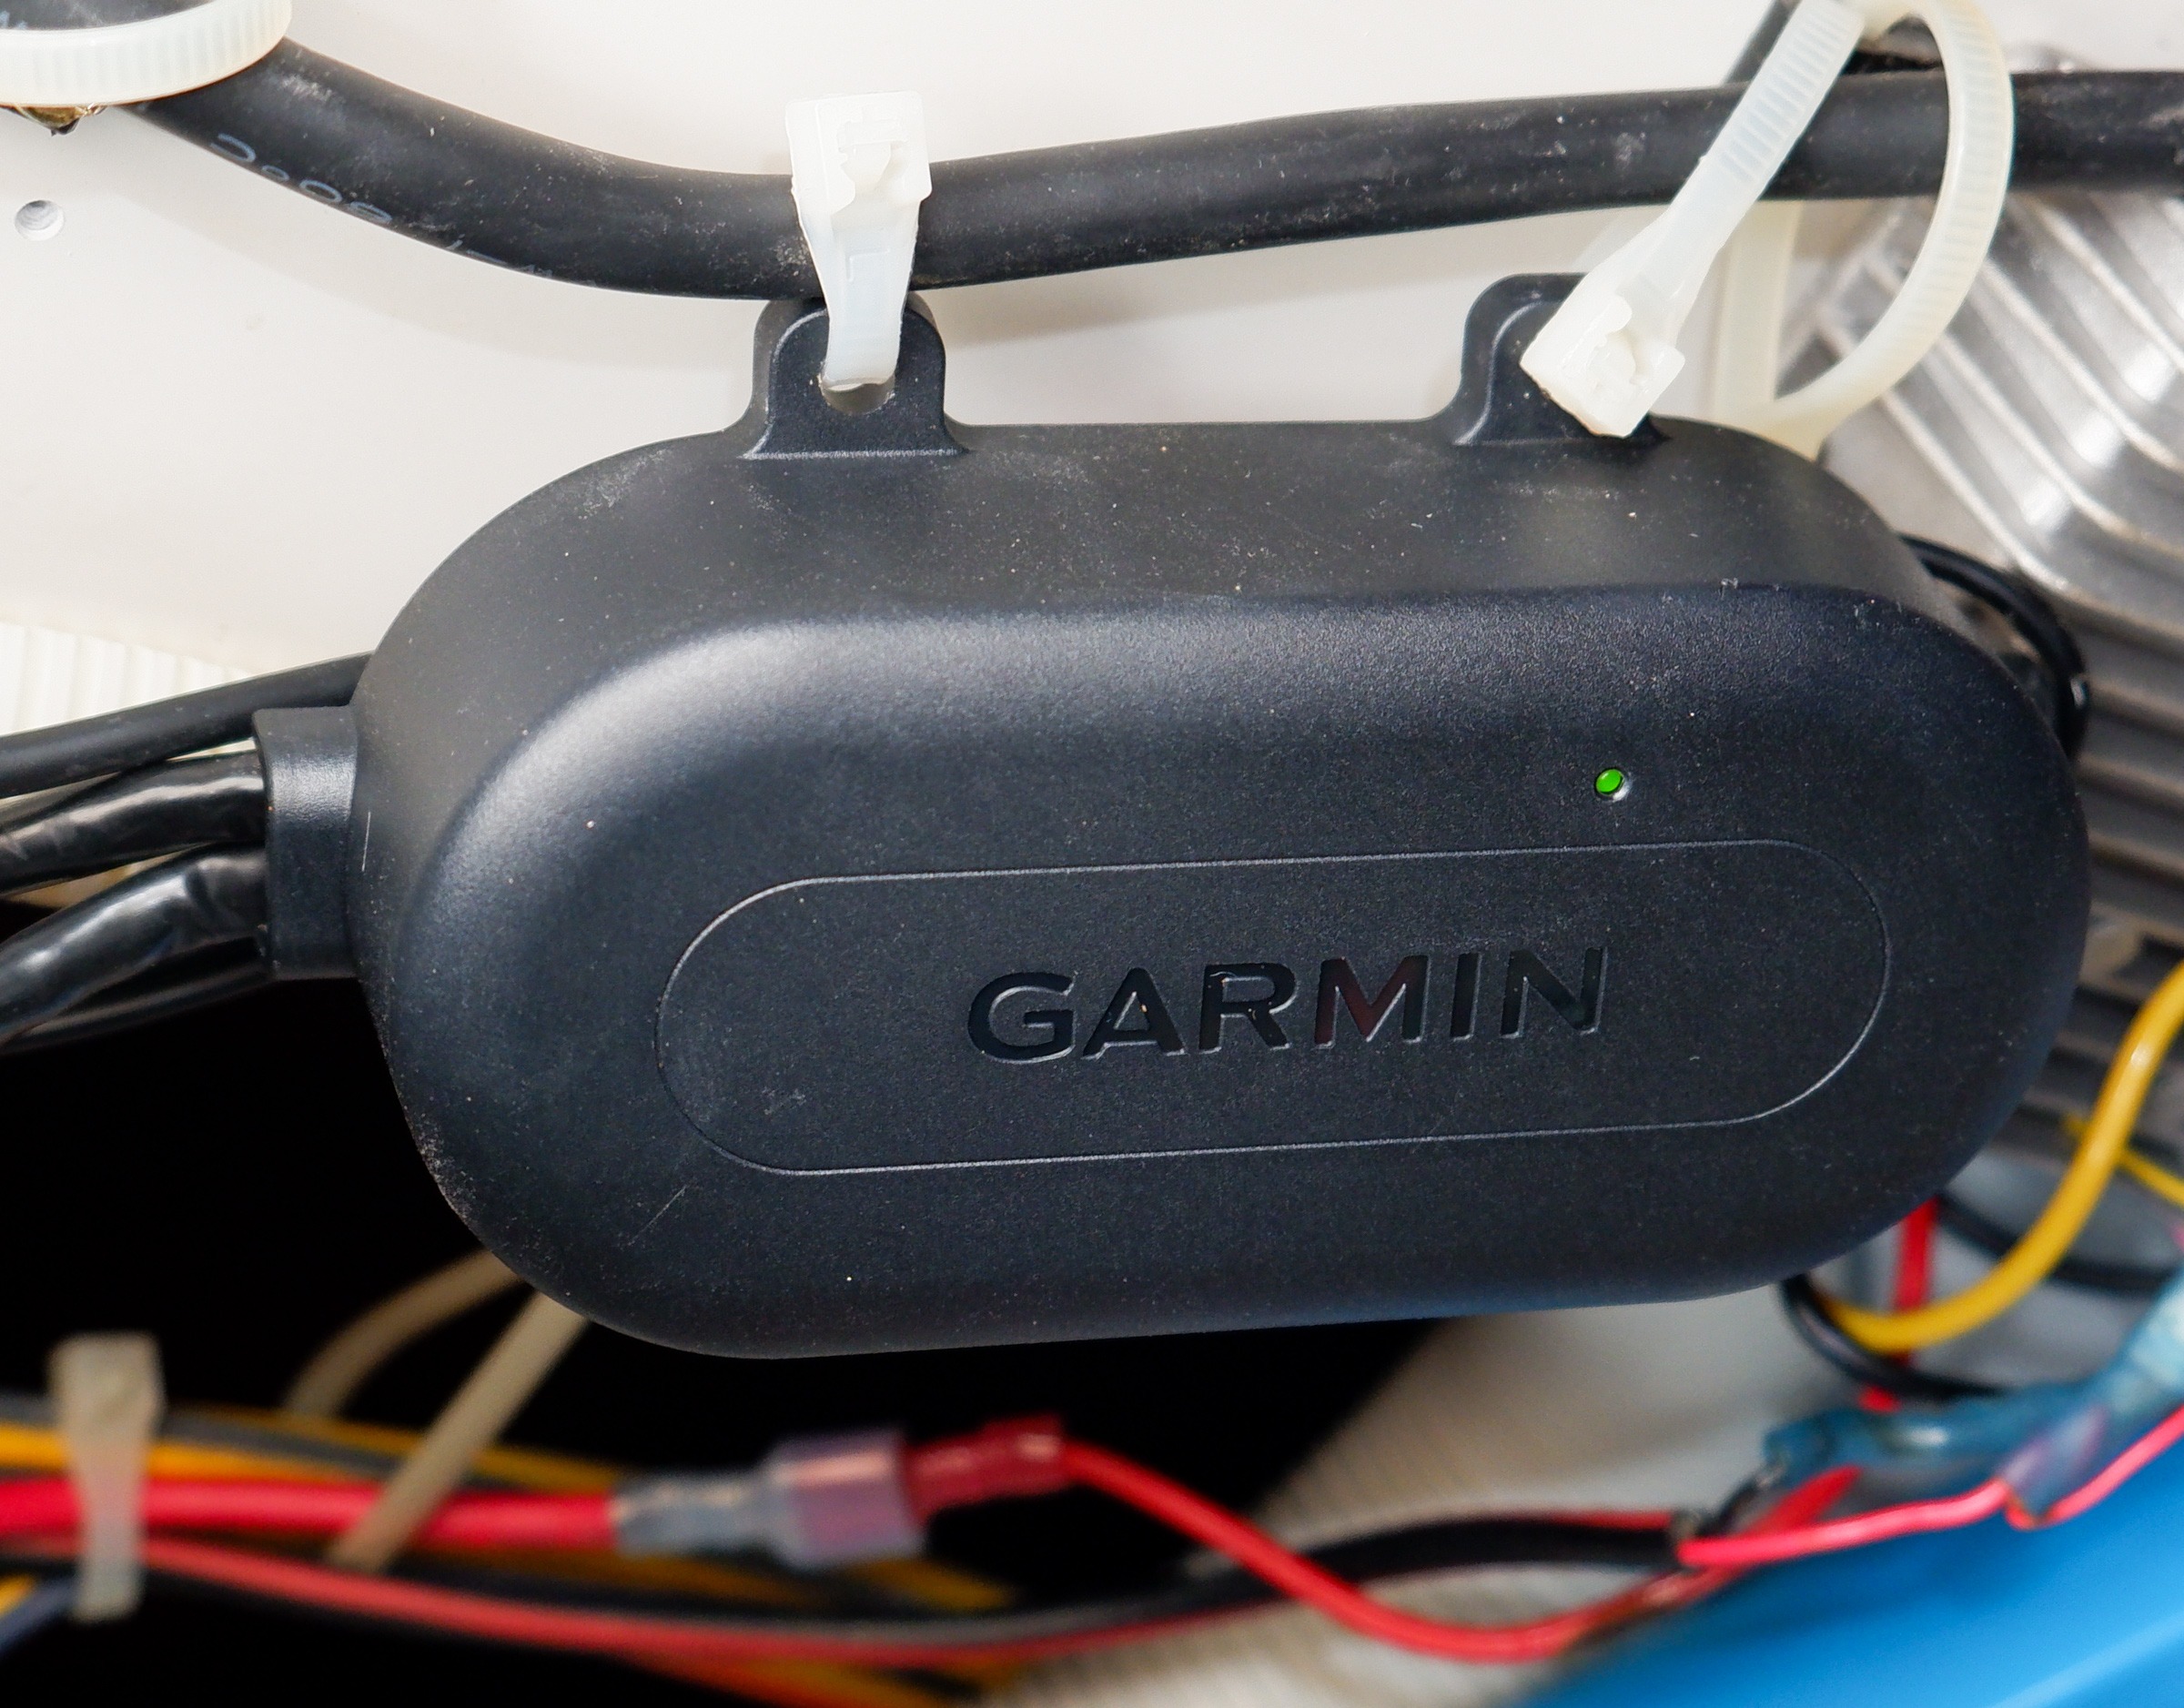
Garmin GXM 54 antenna installed 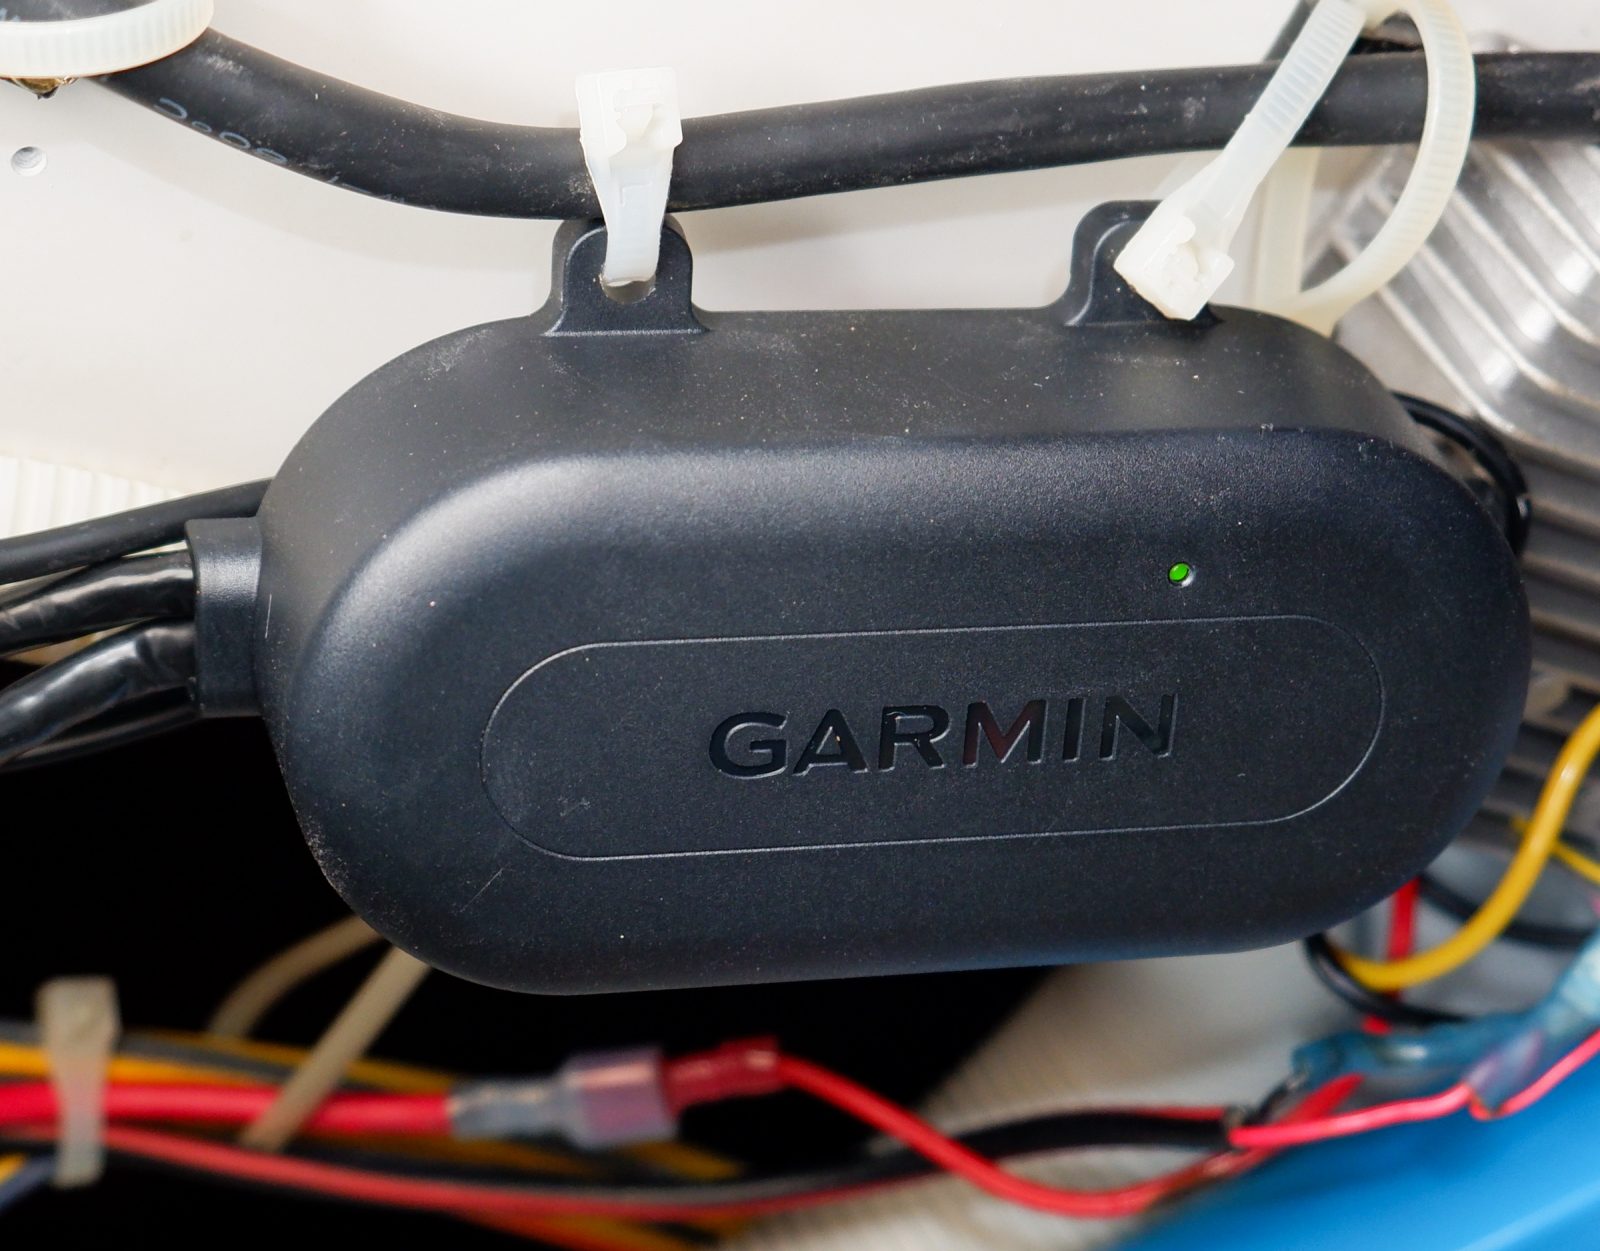
GXM 54 below deck unit 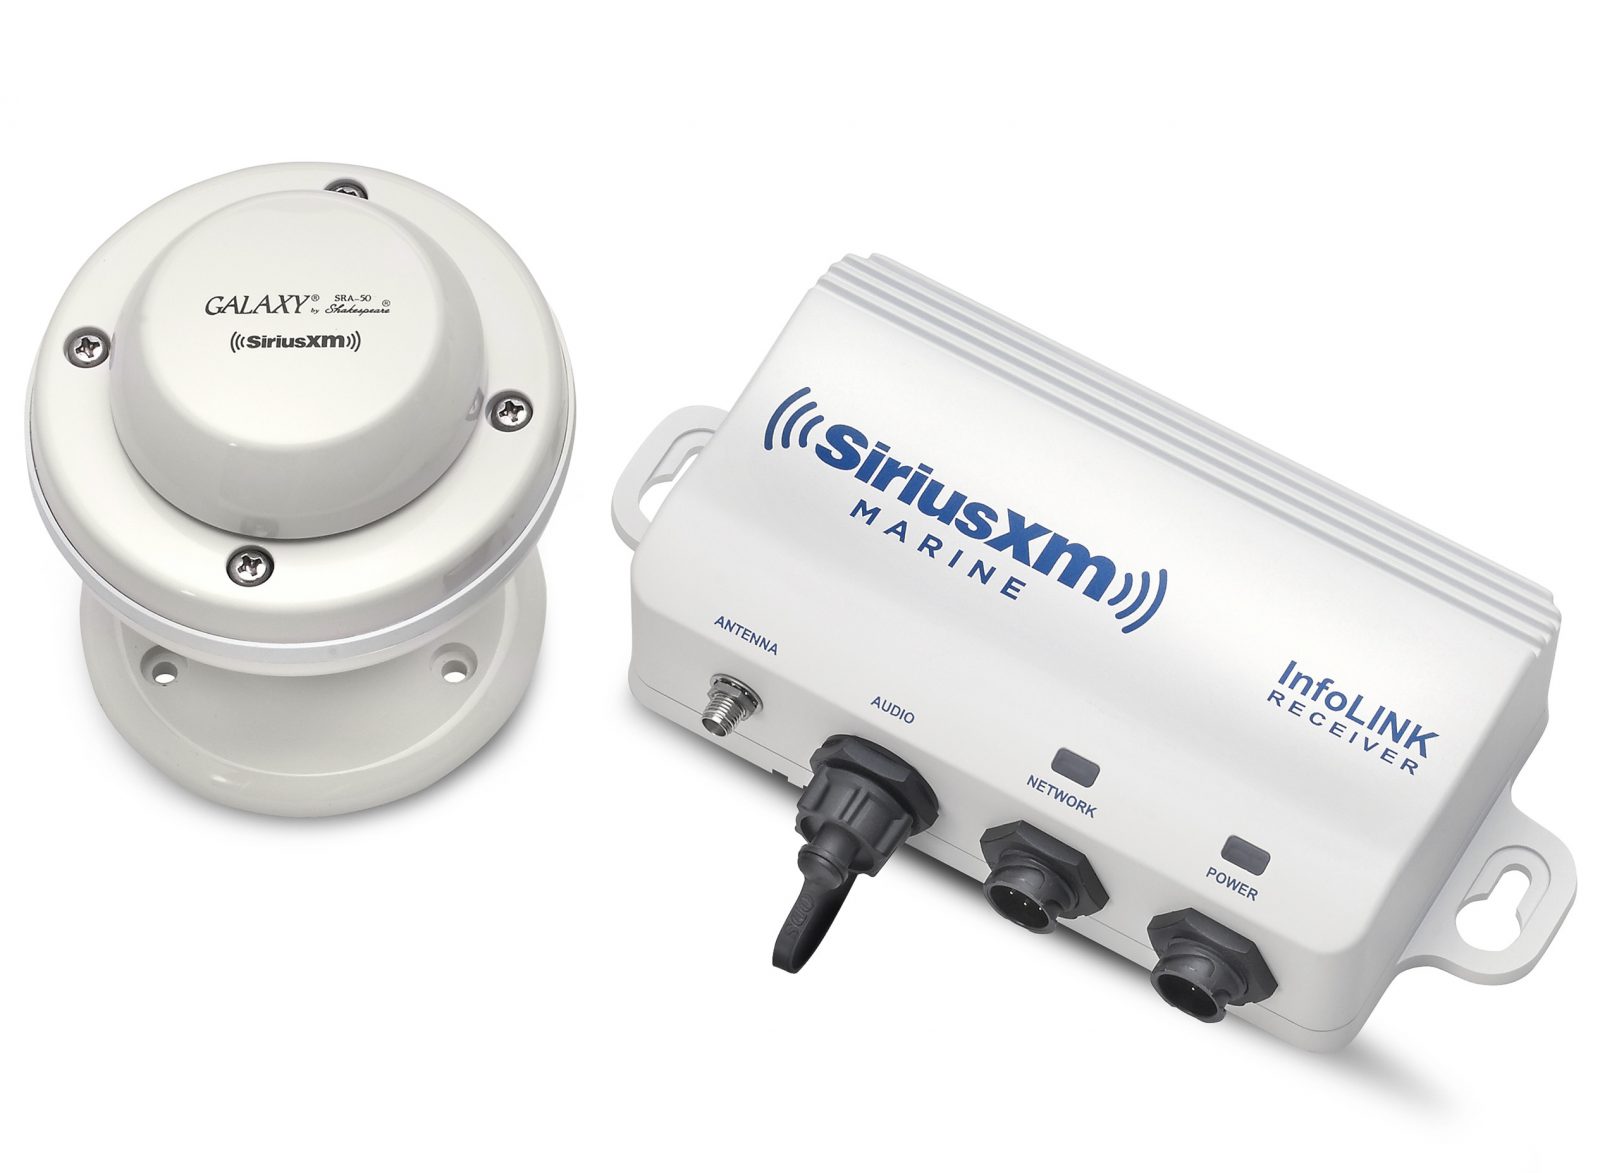
SiriusXM InfoLink receiver
Fish mapping requires a new generation of receiver to collect the extra data included in the package. So far, Furuno, Garmin, and Raymarine have started shipping Fish Mapping capable receivers, but only Garmin has updated their software to display Fish Mapping data. Furuno and Raymarine’s receivers both use SiriusXM’s InfoLink hardware design. Furuno and Raymarine’s receivers both have a list price of $500 and currently SiriusXM is running a $100 rebate offer for all marine weather receivers. Currently Fish Mapping is the only package that requires or takes advantage of the capabilities of the new receiver hardware. So, if you’ve got an older receiver you use just for weather you won’t see any difference from an upgrade.
Garmin used their own hardware design with the new chipset incorporated in their $800 GXM54. Garmin’s design, like previous Garmin SiriusXM receivers, incorporates most of the electronics in the antenna itself. The below deck unit is just a power and connection point.
Fish Mapping features
I should start this section by admitting that I’m a pretty terrible fisherman. The rod holders on Have Another Day are used primarily for a boarding handle and to dry deck brushes, and my fishing gear has mostly rotted away courtesy of salt water and disuse. But, Geoff Leech of SiriusXM was kind enough to walk me through the features and explain how to turn Fish Mapping data into finding fish.
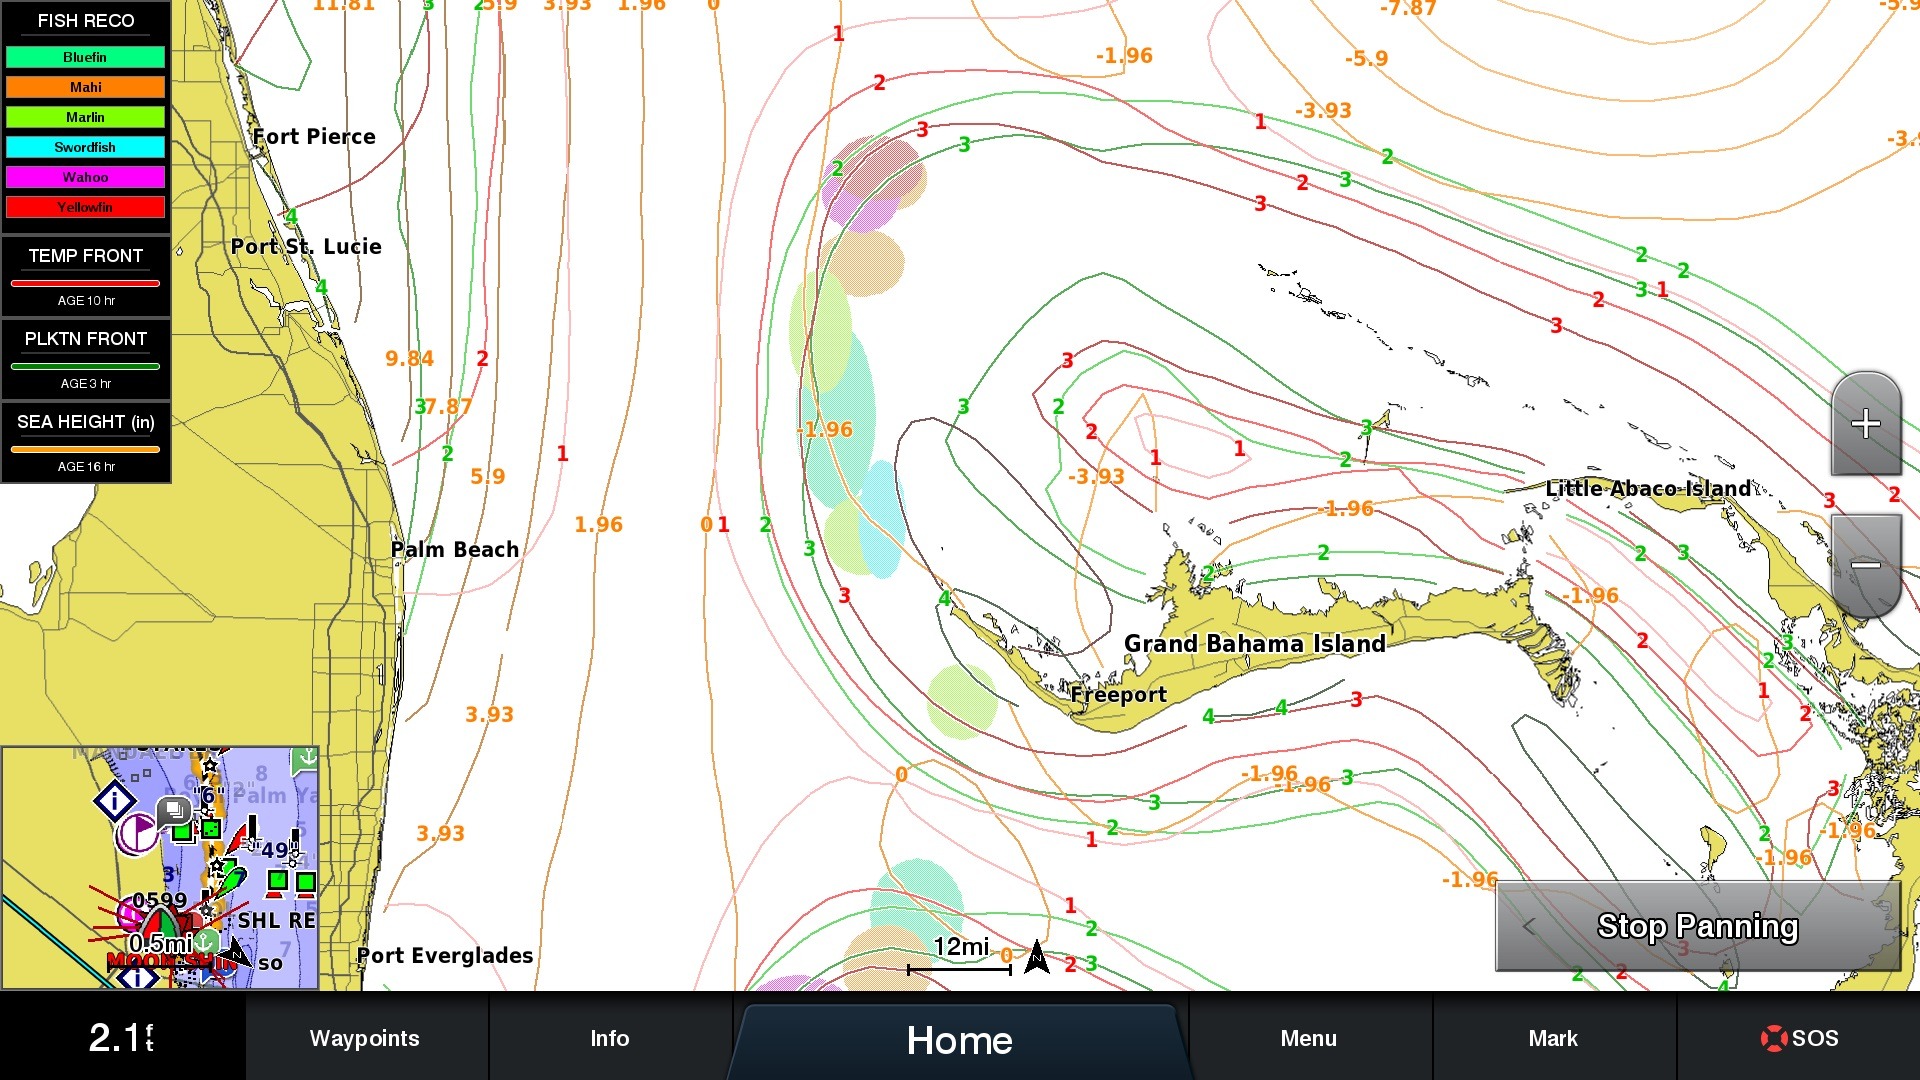
Sea temperatures
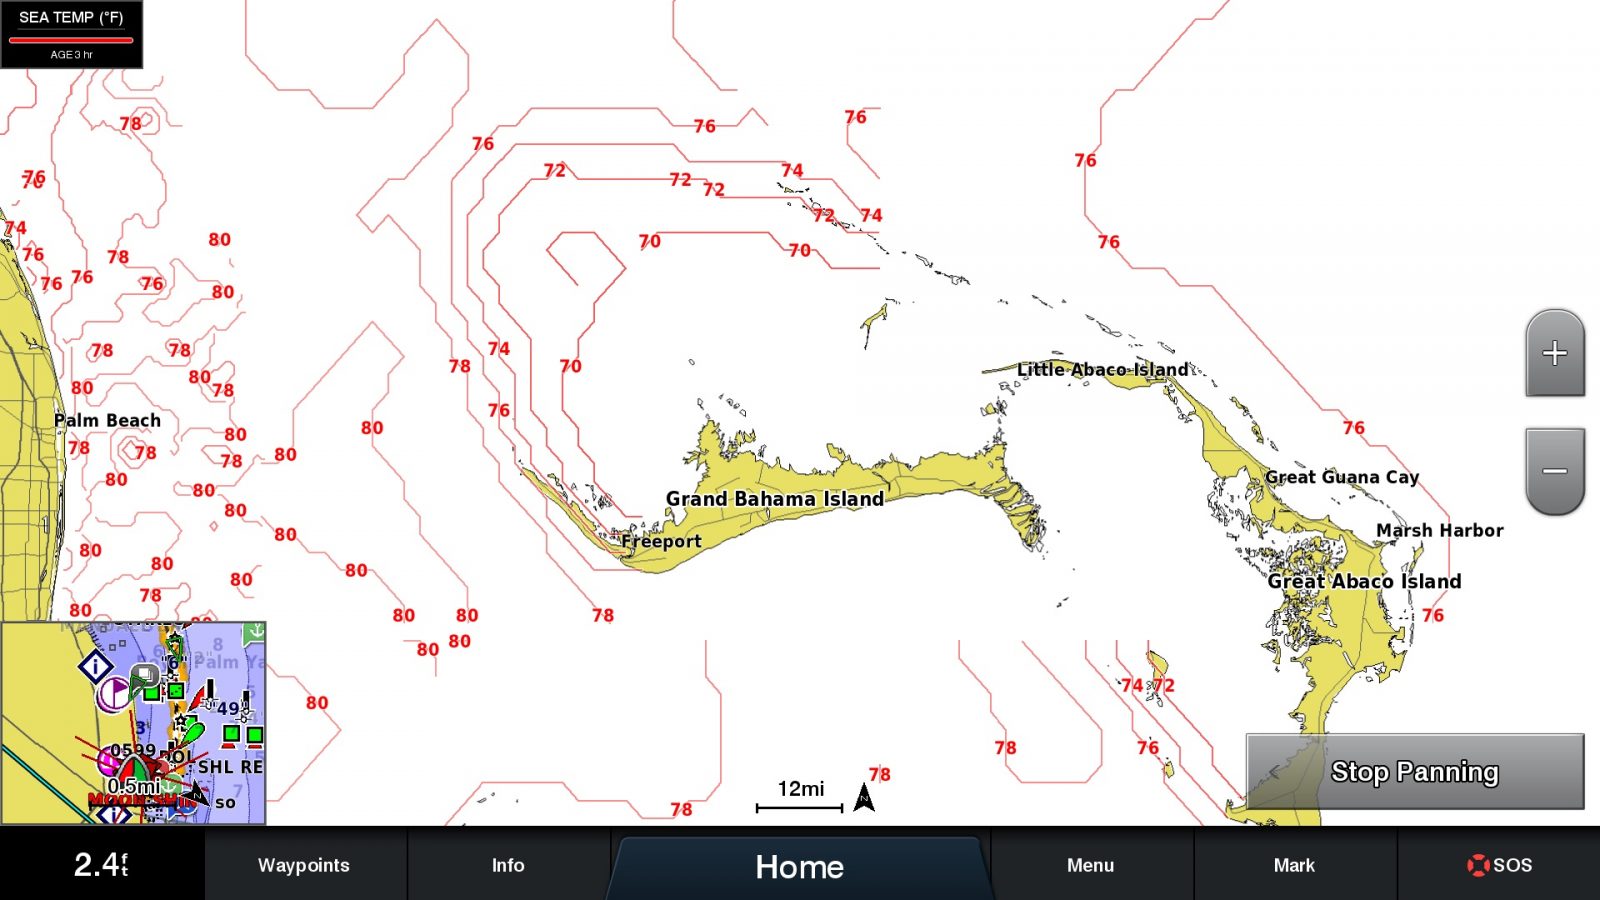

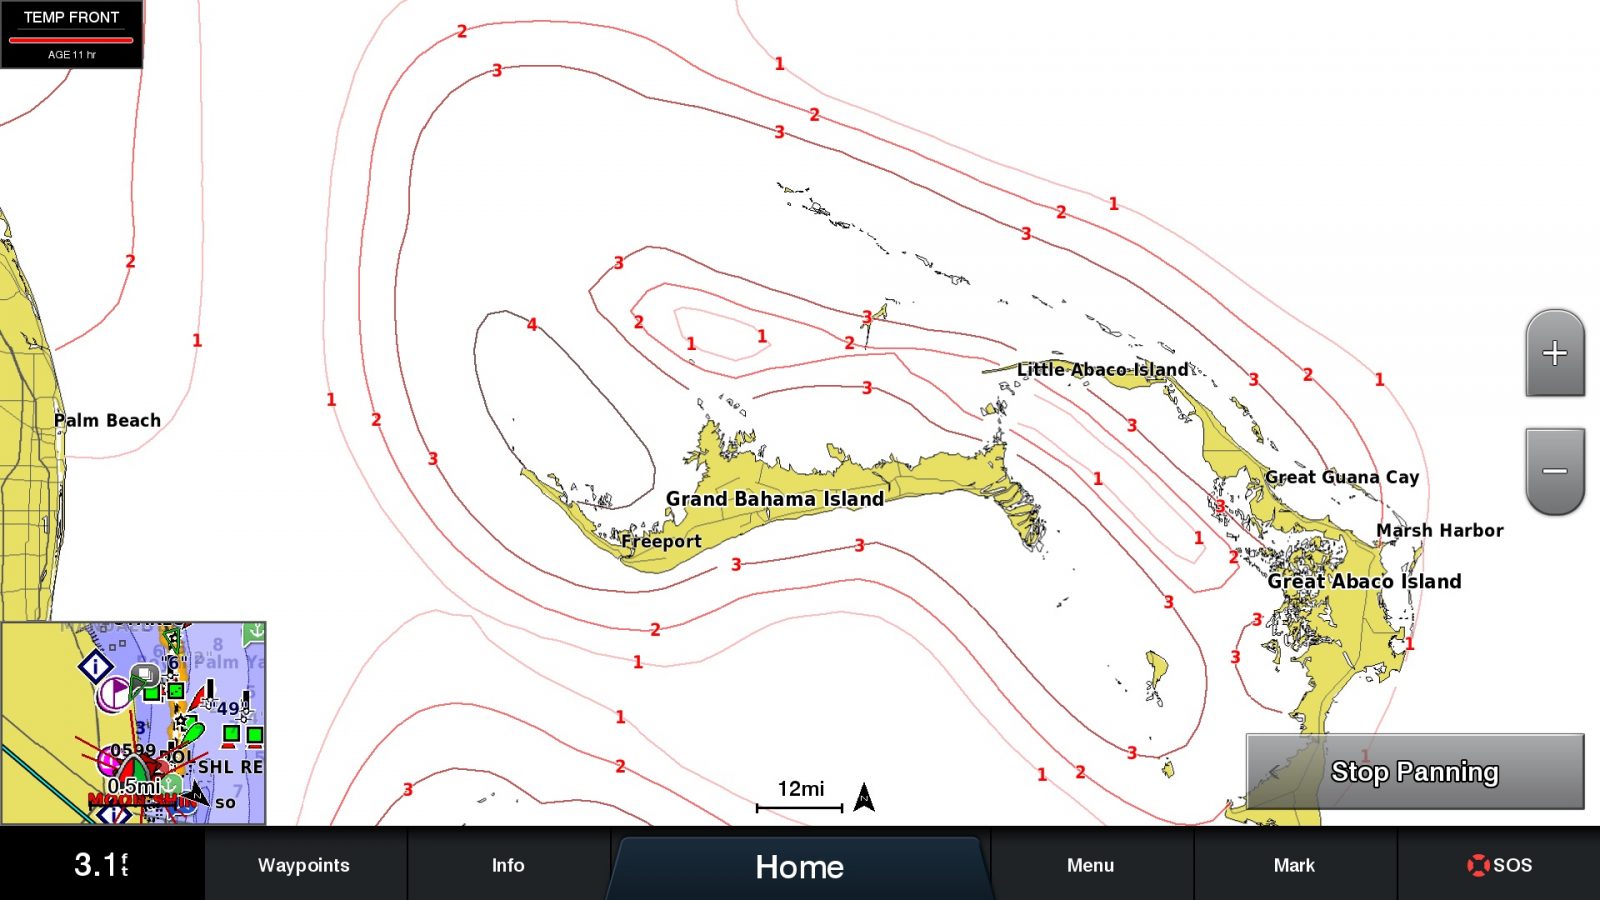
Fish Mapping provides sea surface temperature contours, sea surface front strengths and 30 meter sub-surface temperatures. But, unlike the color-carpet forecast-view, the data is displayed with temperature contour lines. The sea surface temperature contours display surface temperature information while the front strength shows areas of significant temperature differences ranked from one to four. The higher the number, the larger the difference in temperature. The 30 meter sub-surface temperature information gives indications of thermoclines which can be used by anglers who prefer to fish in deeper water.
Plankton

Plankton contours 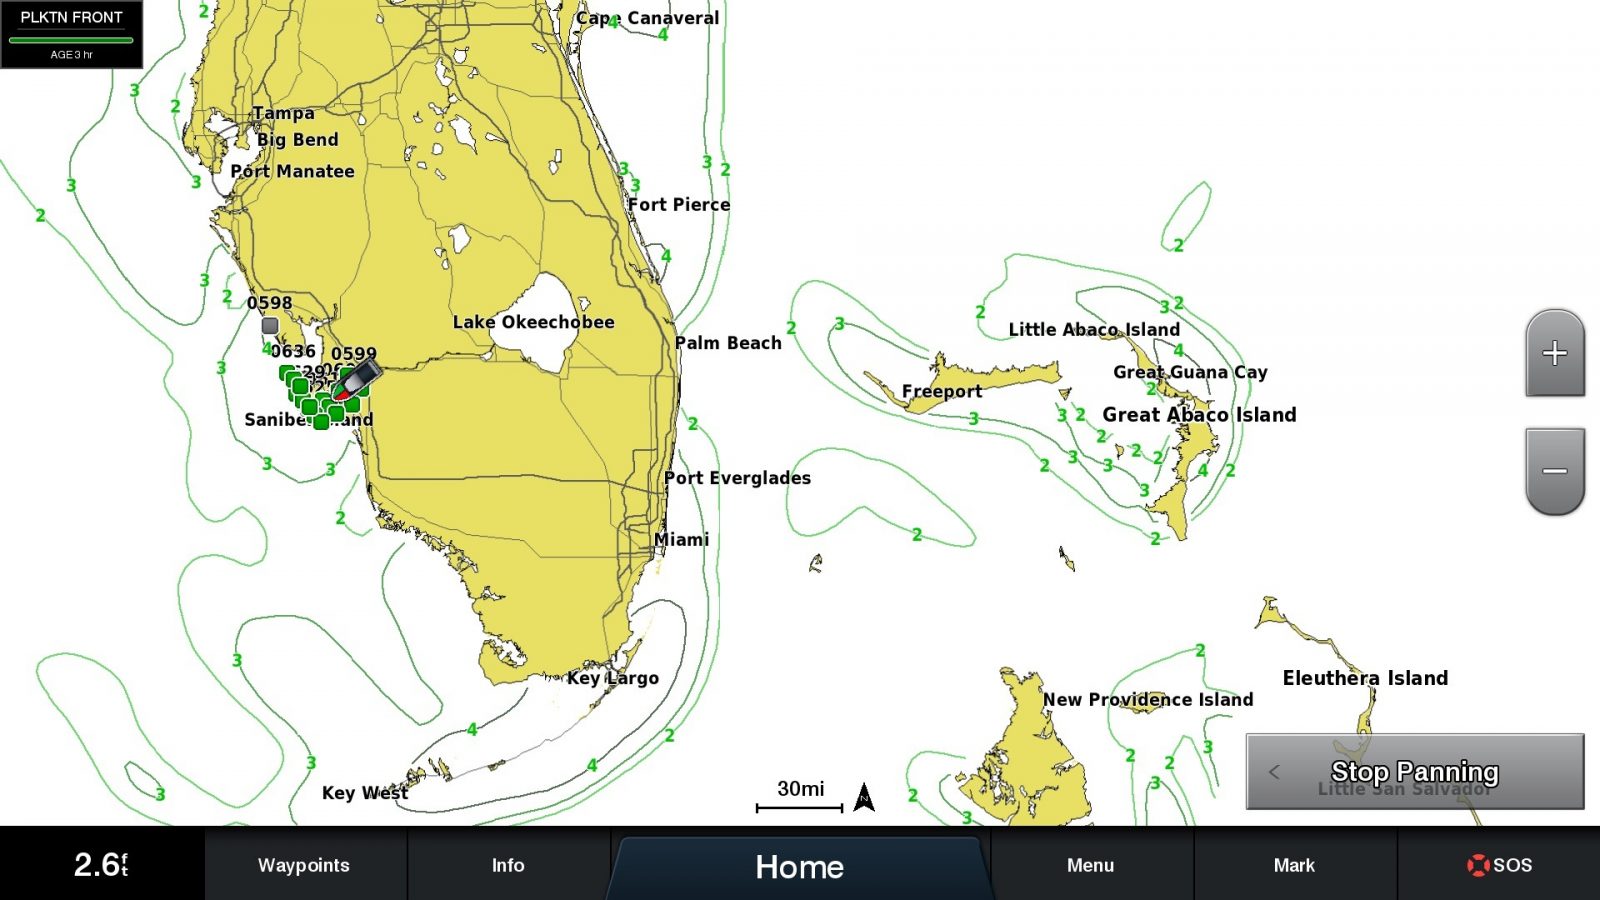
Plankton front strengths
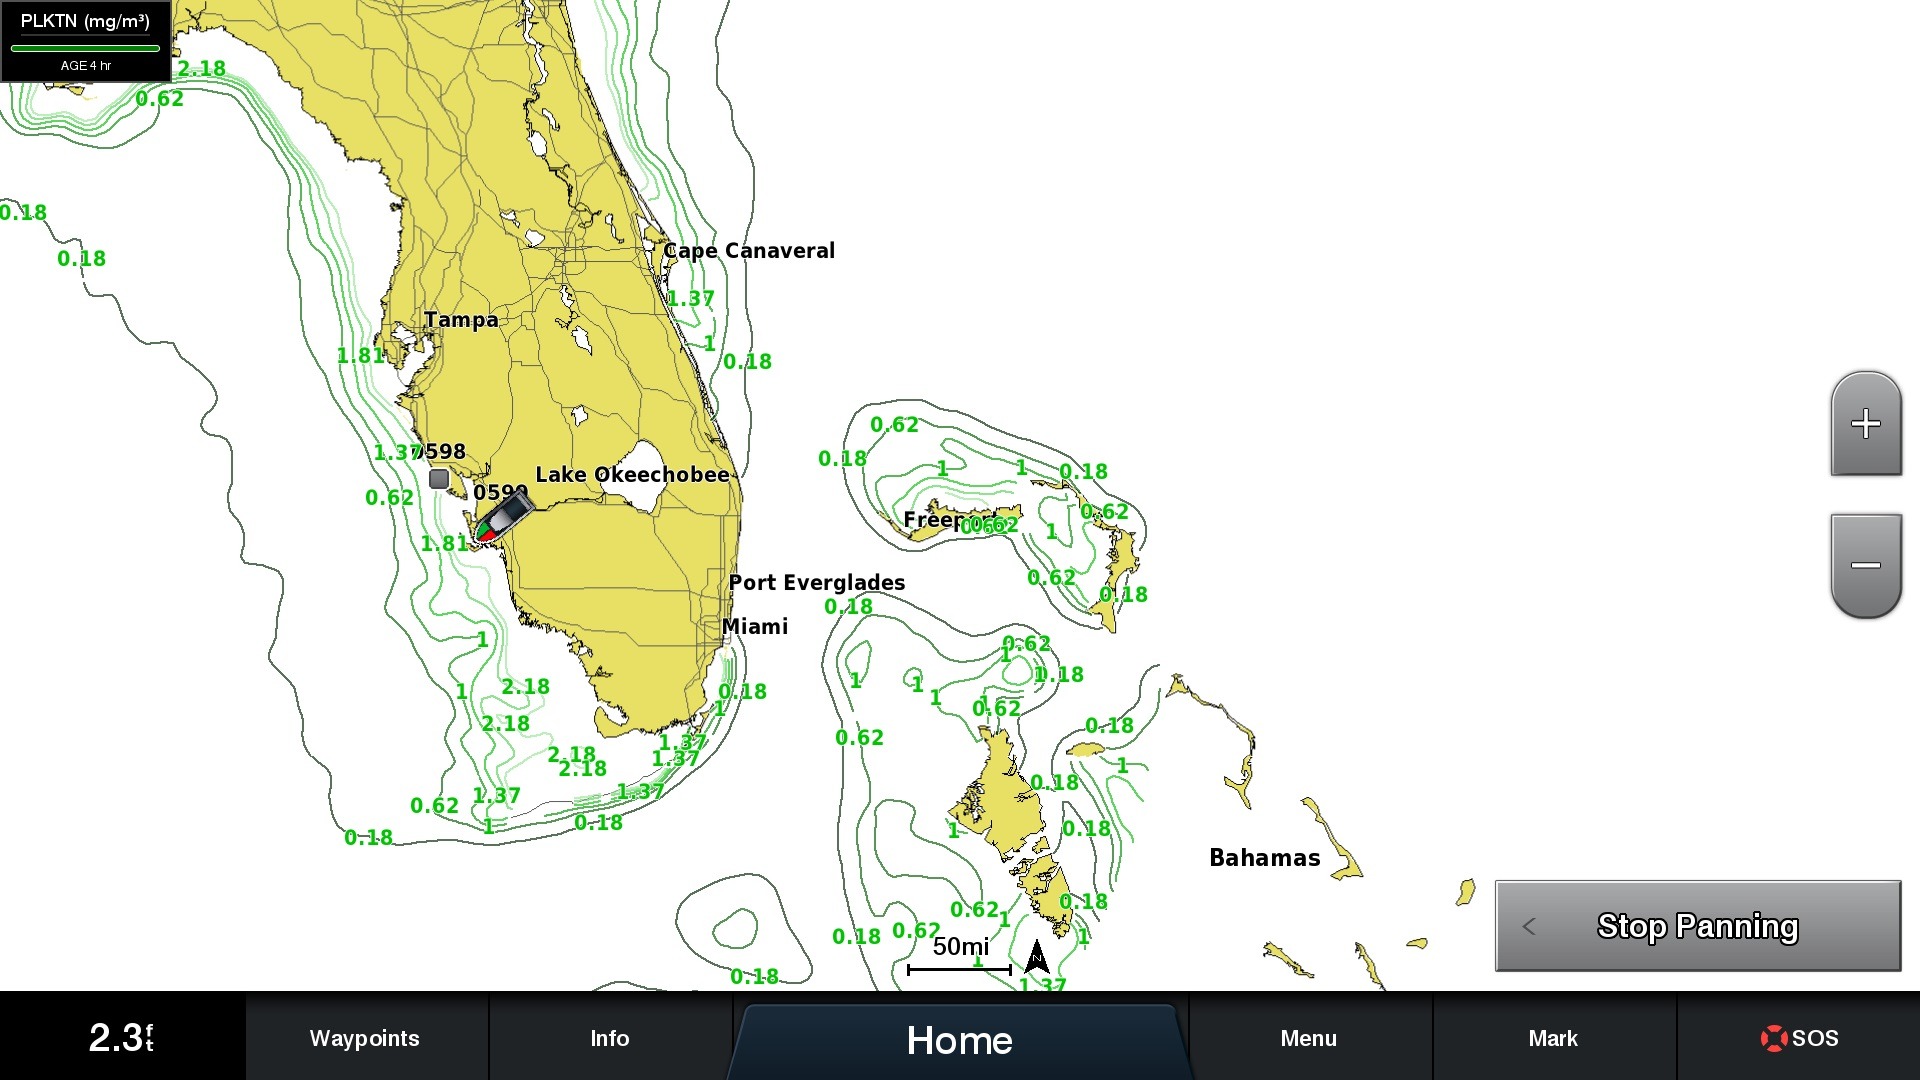
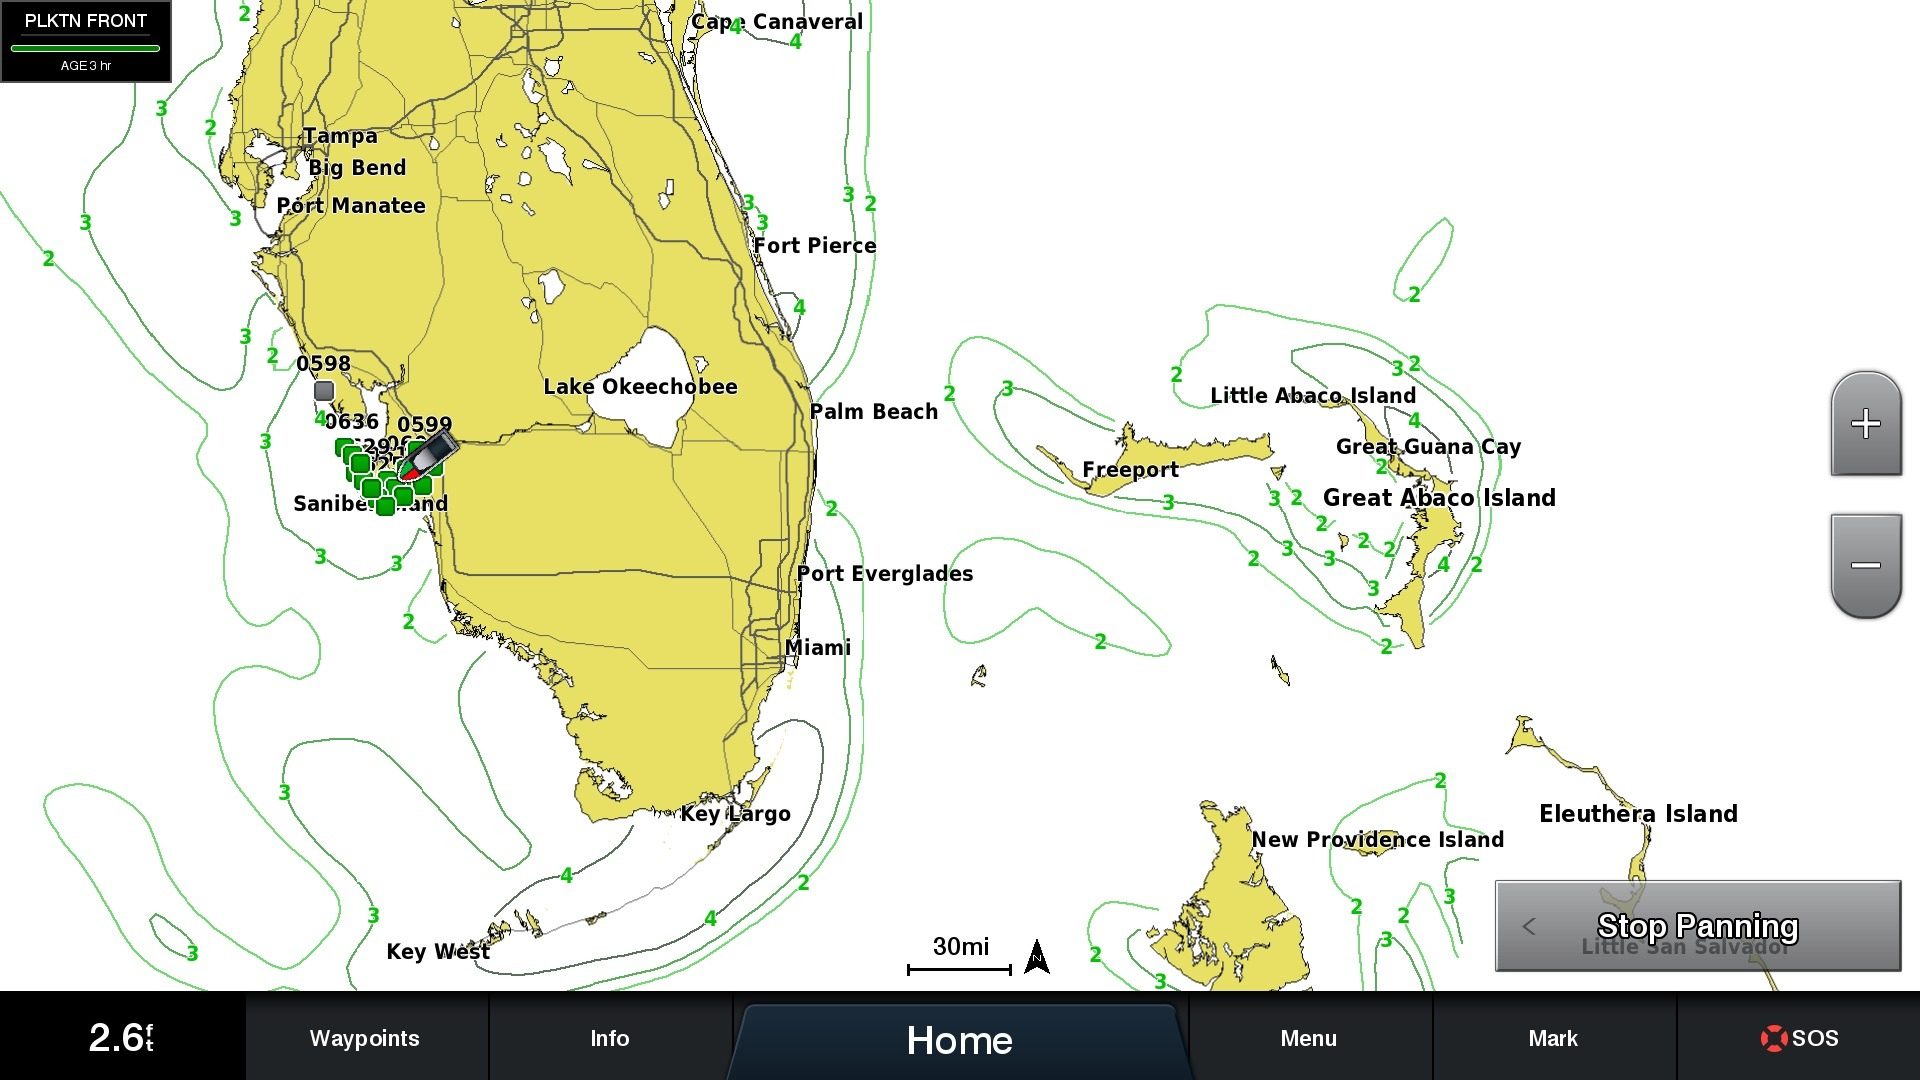
Plankton information can also be displayed either as concentration contours or as front strengths. Geoff Leech explained that fronts can be a useful indicator of hot spots for pelagic species. Pelagic species like to hunt in clear water but the bait fish they feed on look for plankton rich areas. Strong fronts are areas where low concentrations meet high concentrations. This allows the pelagic species to hunt in clear water on the edge of plankton rich waters with bait fish.
Sea surface height

Sea surface height anomalies are displayed as contours in inches. Higher sea surface heights are an indication of upwelling (I had to look it up) or deep, nutrient rich water being brought to the surface. Lower heights indicate downwelling or surface water being forced down. Upwelling can be a helpful indicator of good fishing conditions while downwelling typically indicates areas of poorer fishing.
Weed lines
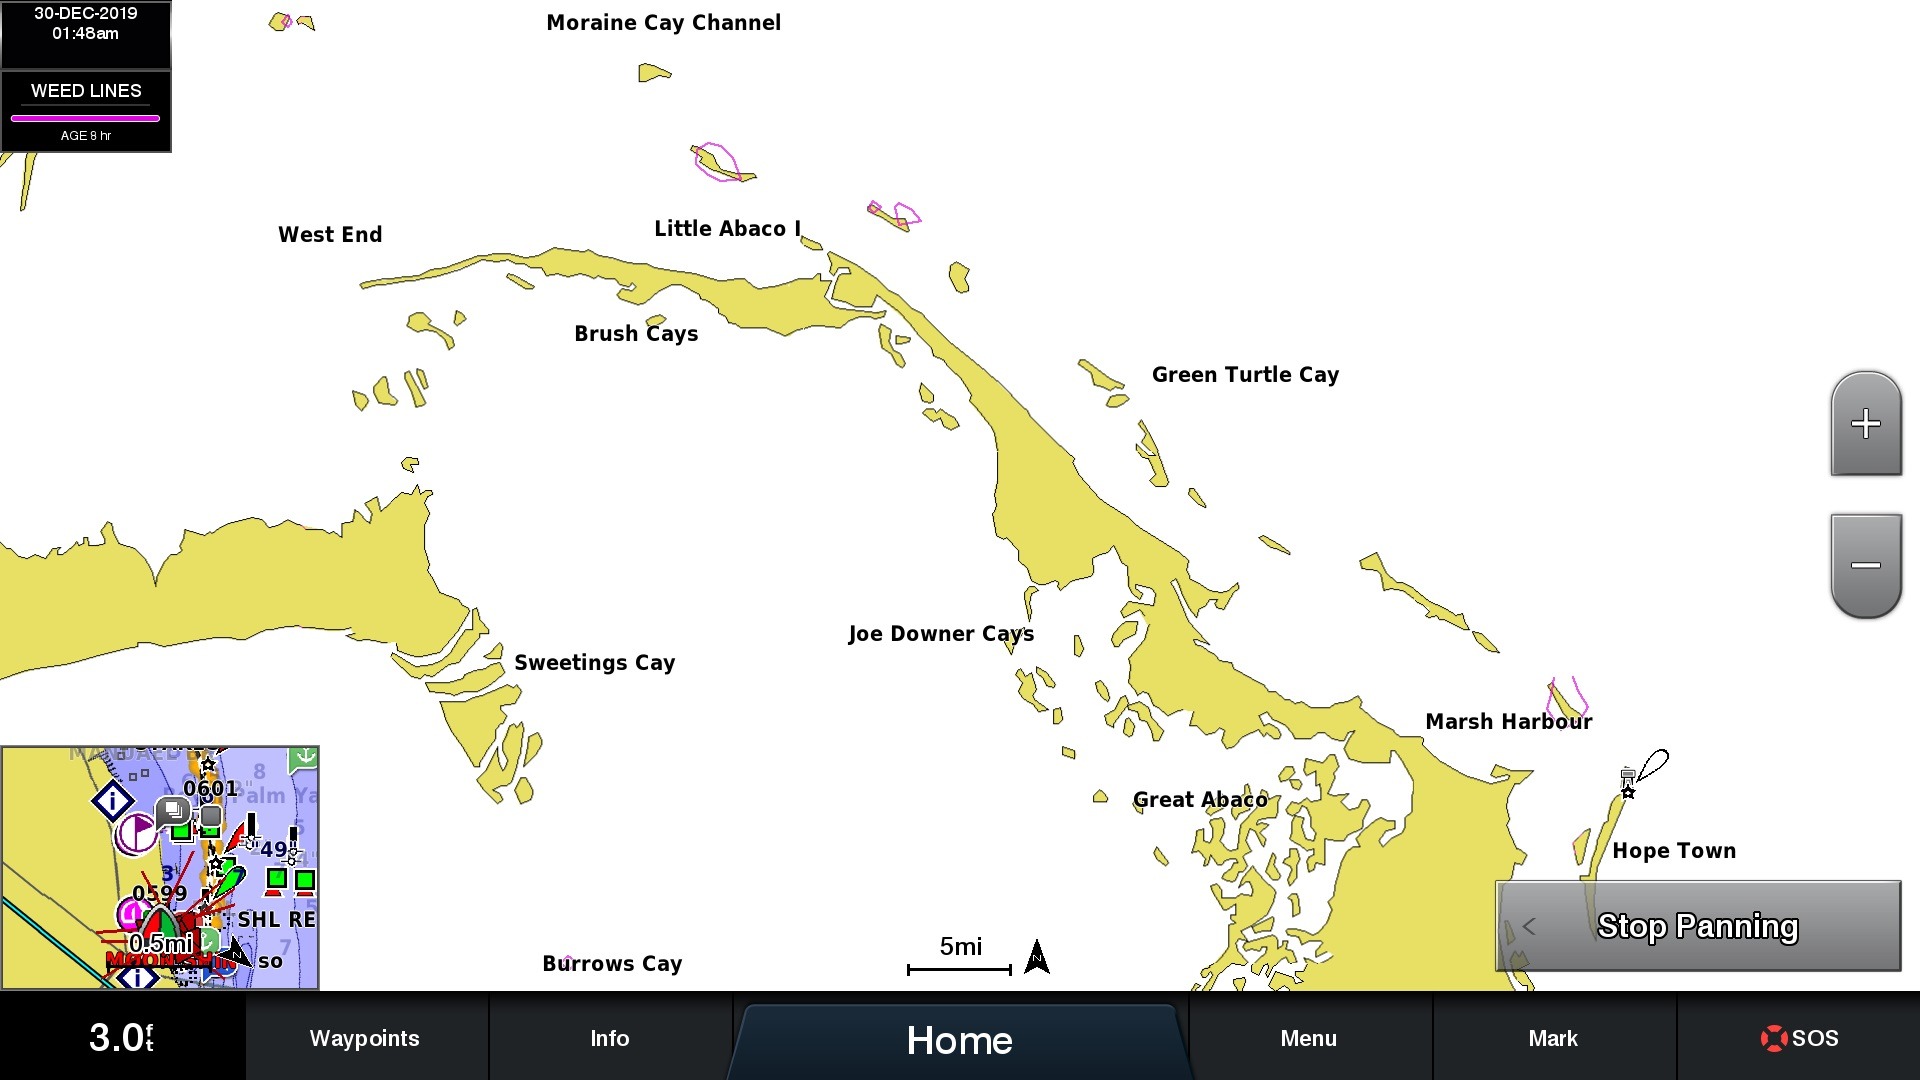
Weed lines show the location of weeds and floating algae. These areas provide both food and protection to bait fish, shrimp, etc and in turn the bait fish attract larger predatory fish. Because they drift and change over time, weed lines can be difficult to locate. The purple circles and lines on a Fish Mapping display show areas where weed lines have been spotted or are modeled to be likely to develop.
Fish recommendations
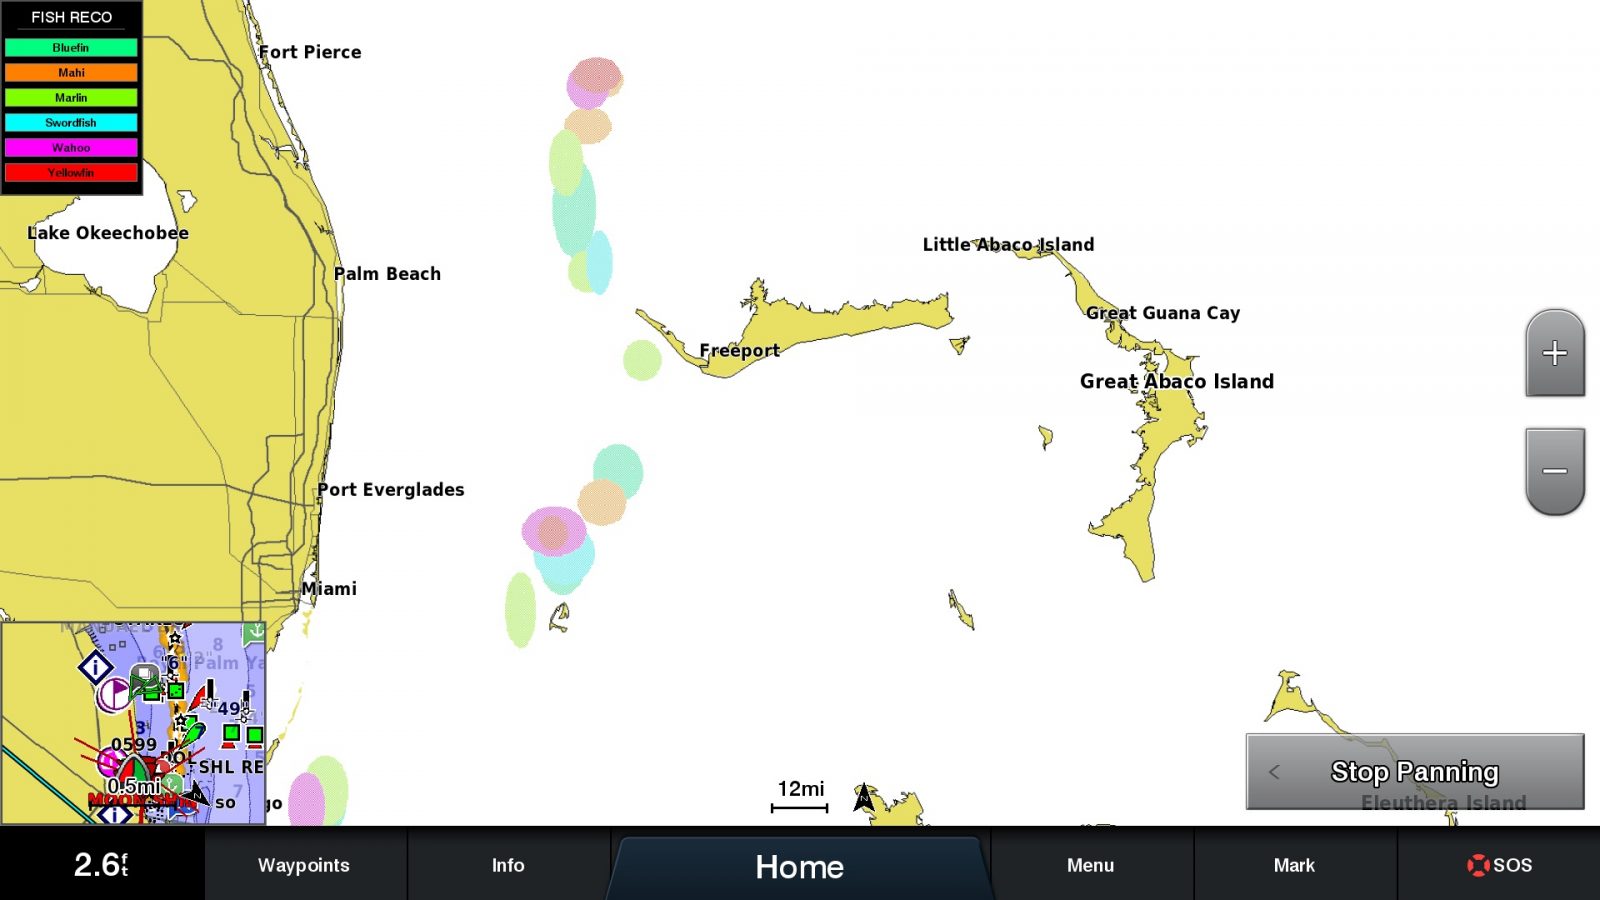
Fish recommendations are updated twice a week on Tuesdays and Fridays by SiriusXM oceanographers. The oceanographers interpret the data collected and determine likely hot-spots. Geoff Leech took the time to point out that the recommendations are areas with a higher probability of fish present. That’s not to say there aren’t fish in other locations and nor is it a guarantee of fish in the recommendation area. Currently they provide recommendations for six species of fish, though they say there are some changes coming with the species mix.
Data update rates
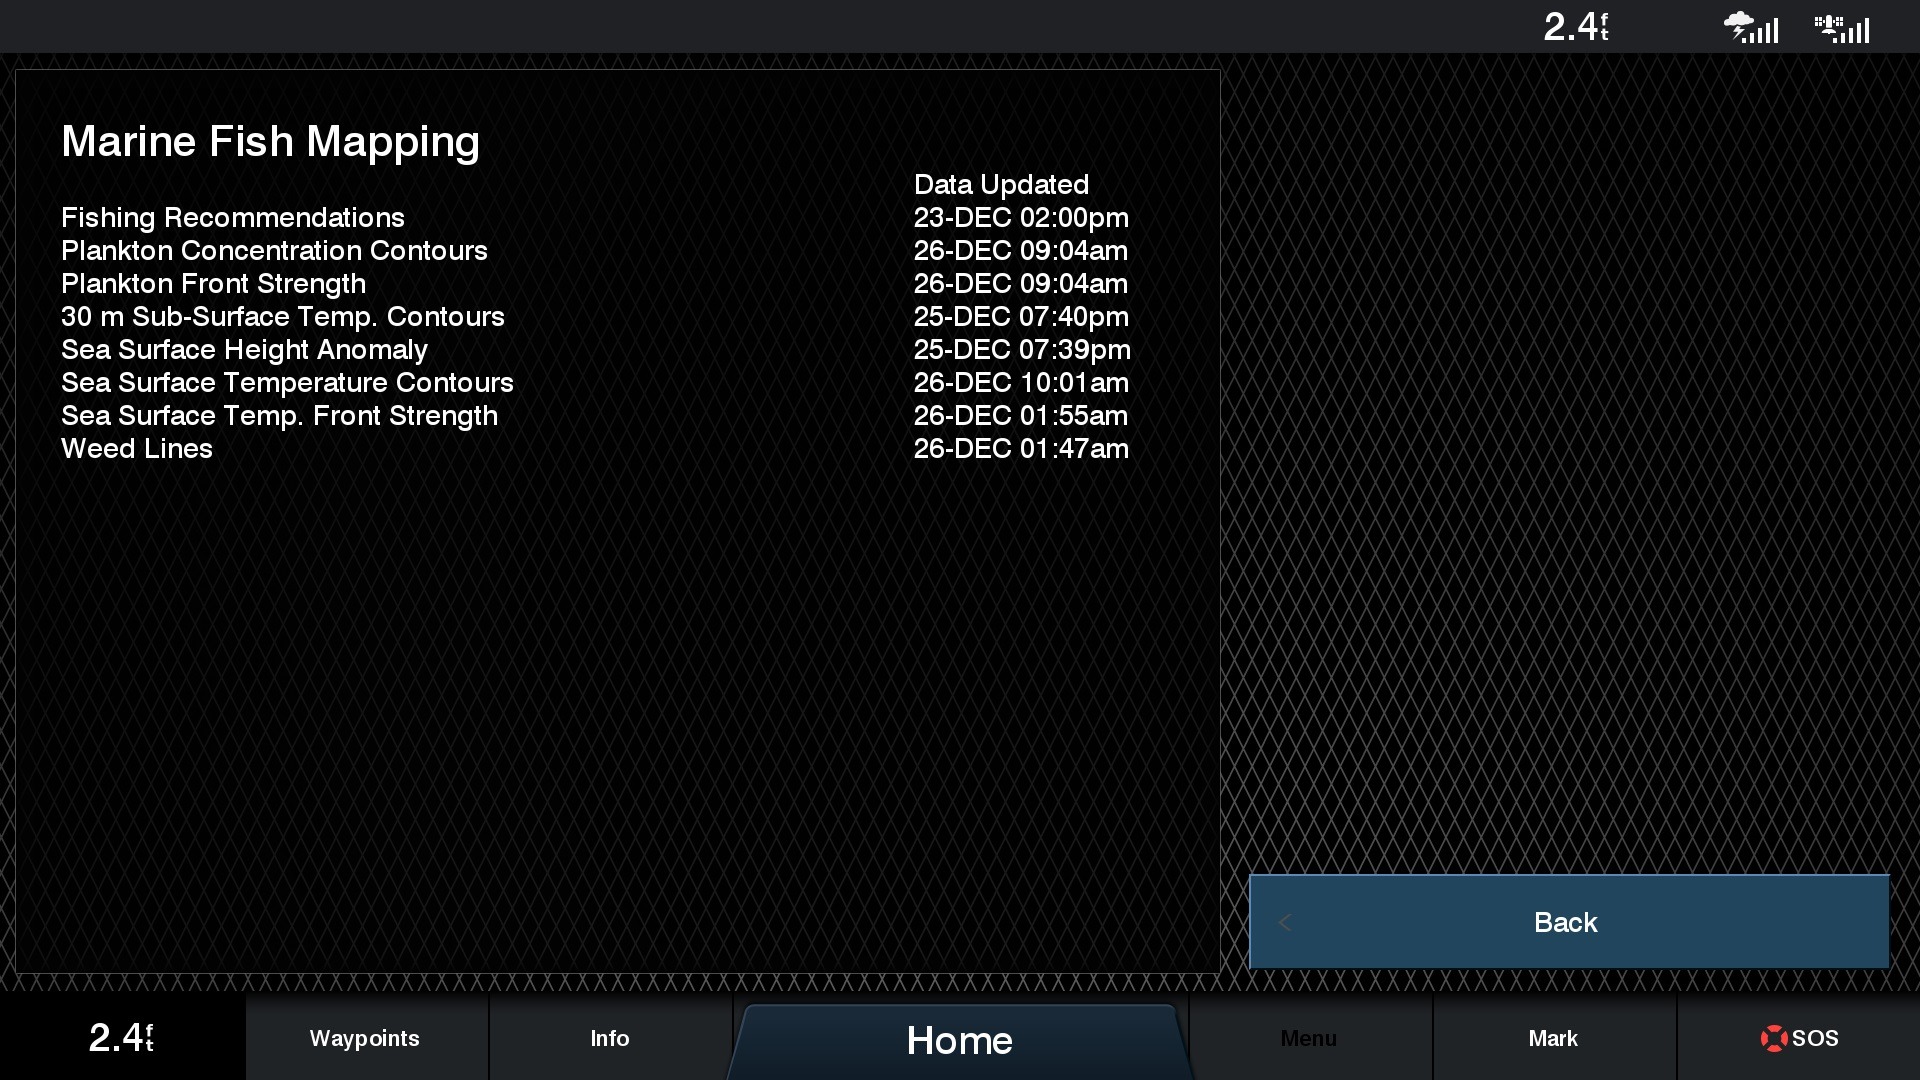

Each of the data types is updated on a schedule that varies based on the data, ranging from every three hours (sea surface temperature) to twice a week (fishing recommendations). In addition, all the data is re-transmitted on a 20 minute loop. This loop means that if you cold start your system it may take up to 20 minutes for all the data to populate. So, before you decide where to head you should make sure all the data has downloaded. Fortunately Garmin makes this very easy with the Weather Subscription status screens shown above. The one on the left shows when the underlying data was last updated while the one on the right shows when it was last received by the MFD. Additionally, the on-screen legend shows the age of each data type.
Weather
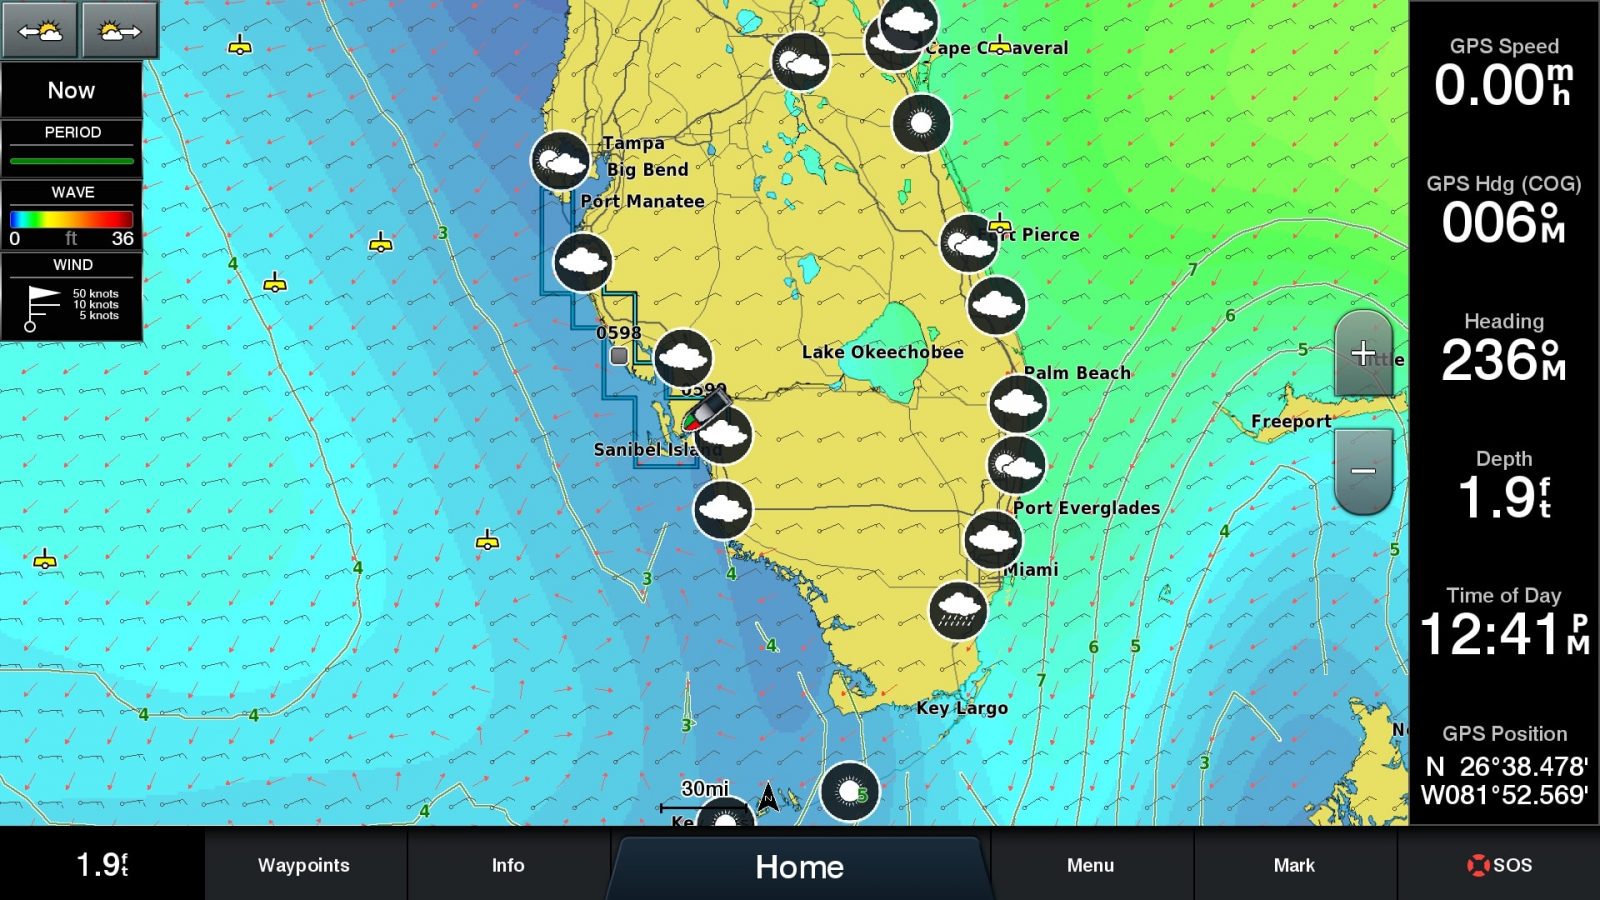
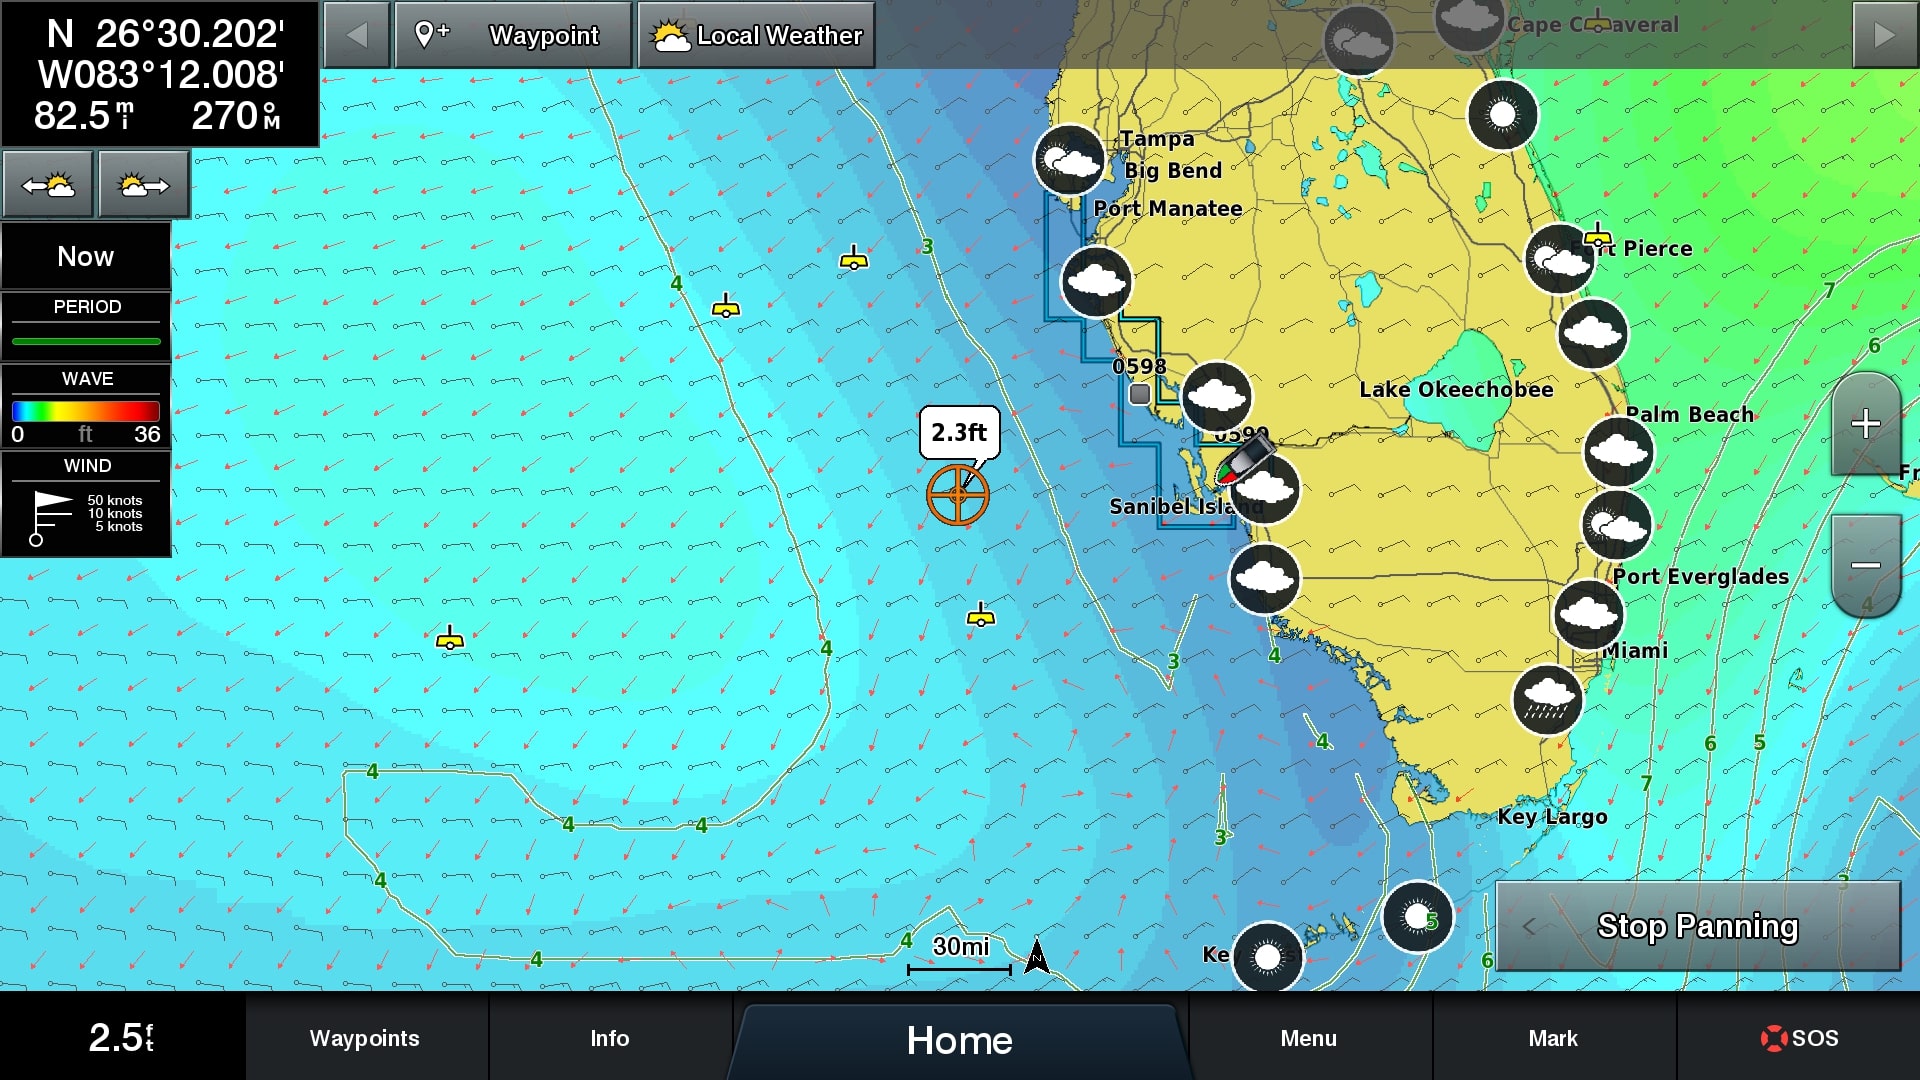
Wave height displayed by color with wind and wave period overlayed 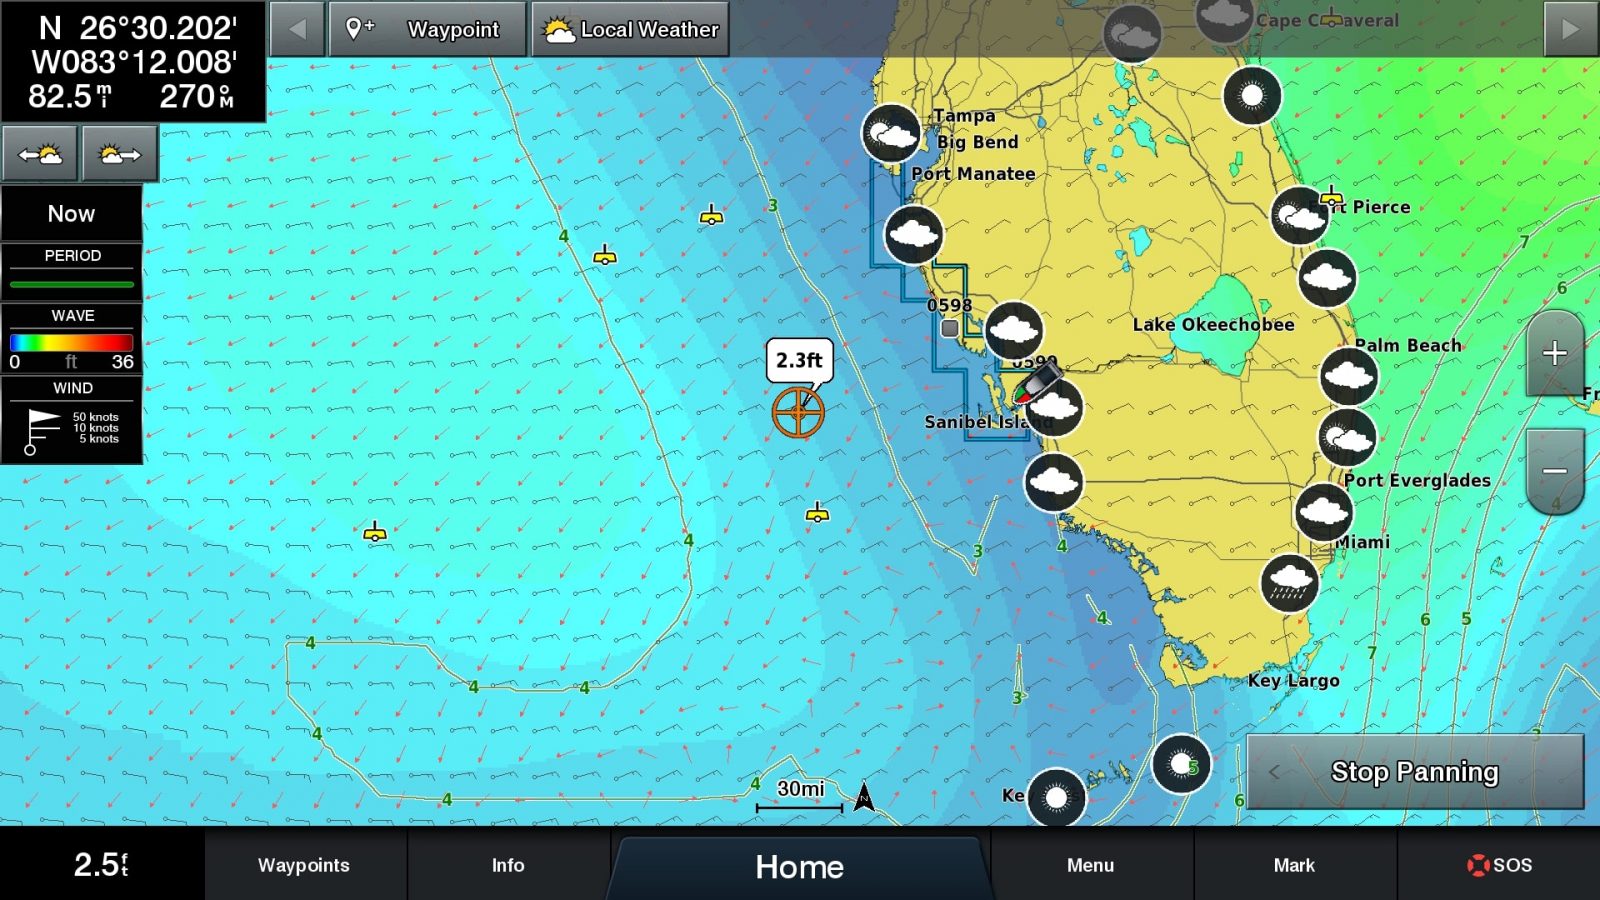
Wind and Wave with a sample point selected to display wave height at that location 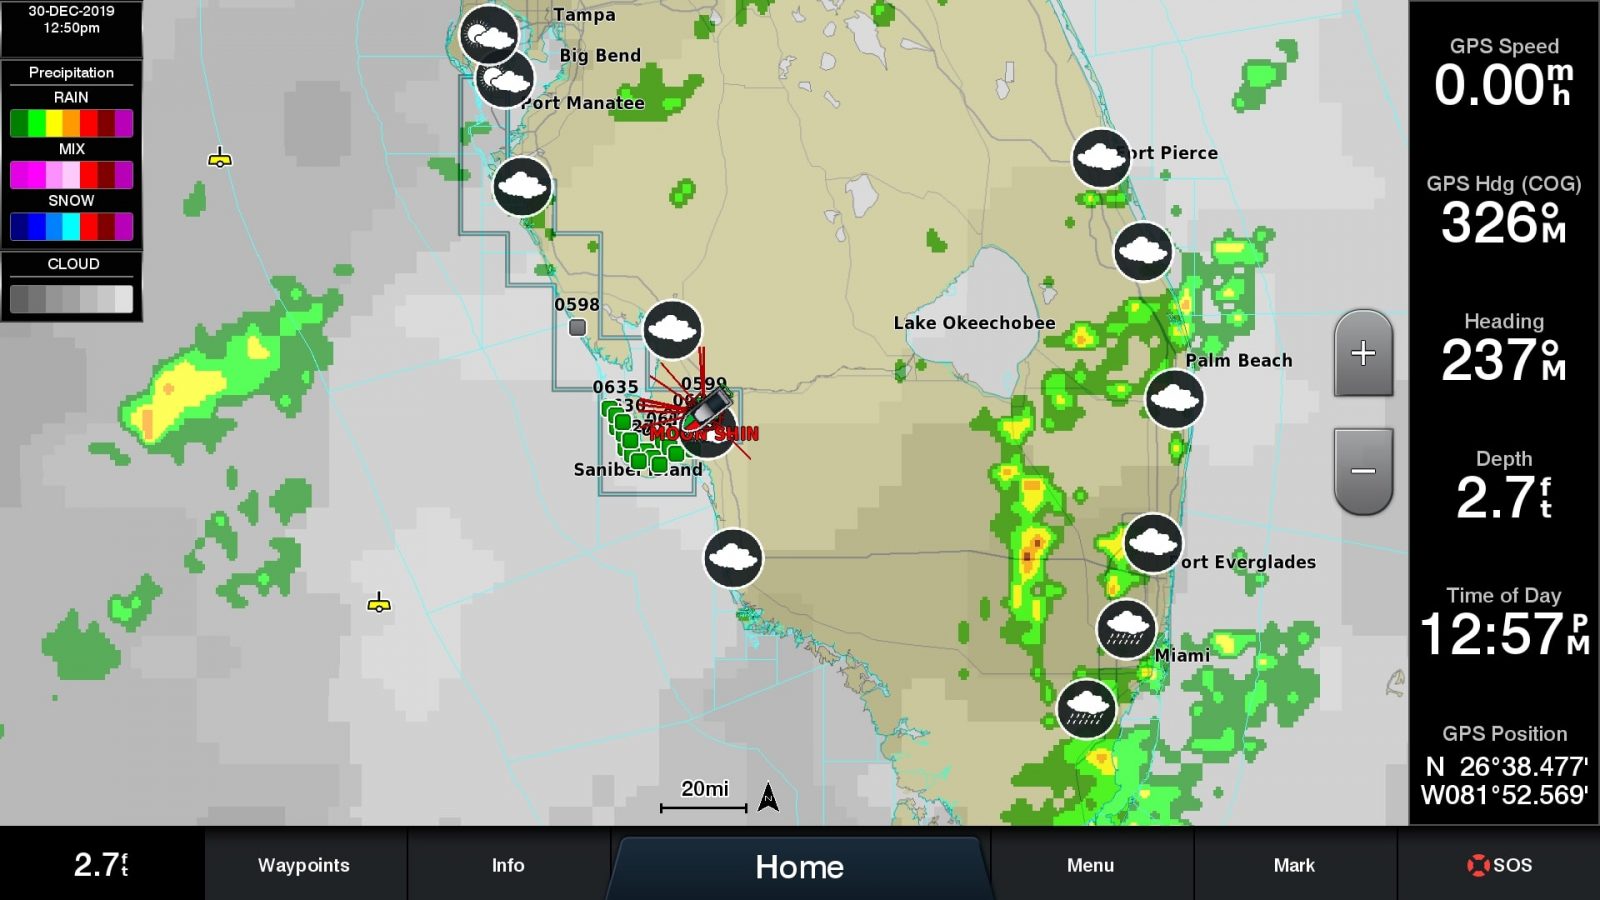
Weather radar showing precipitation 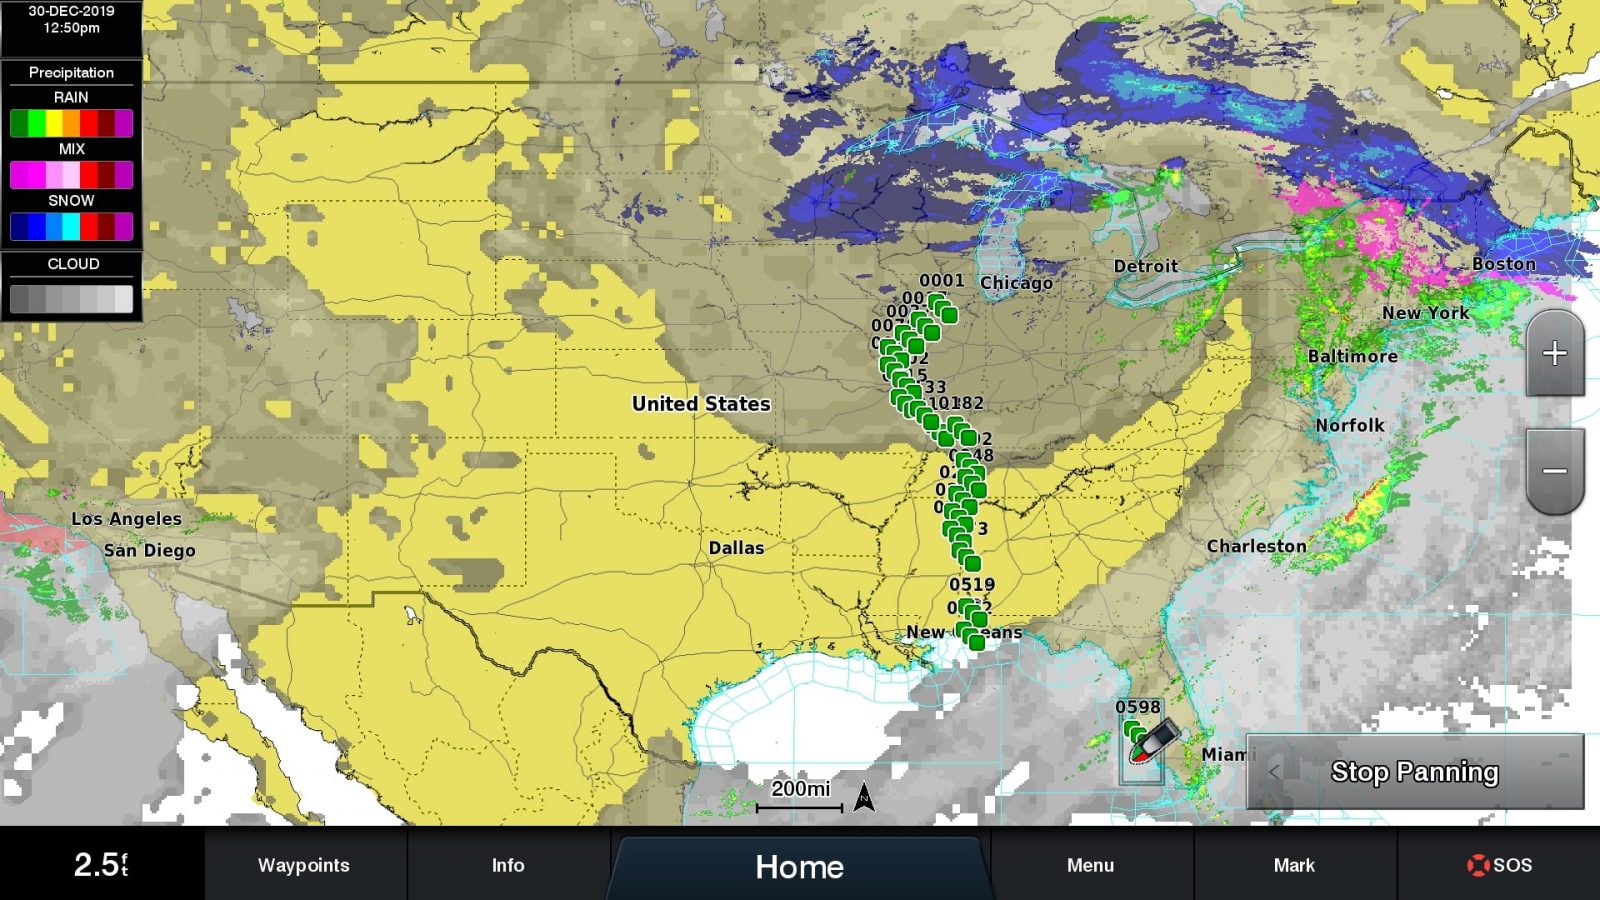
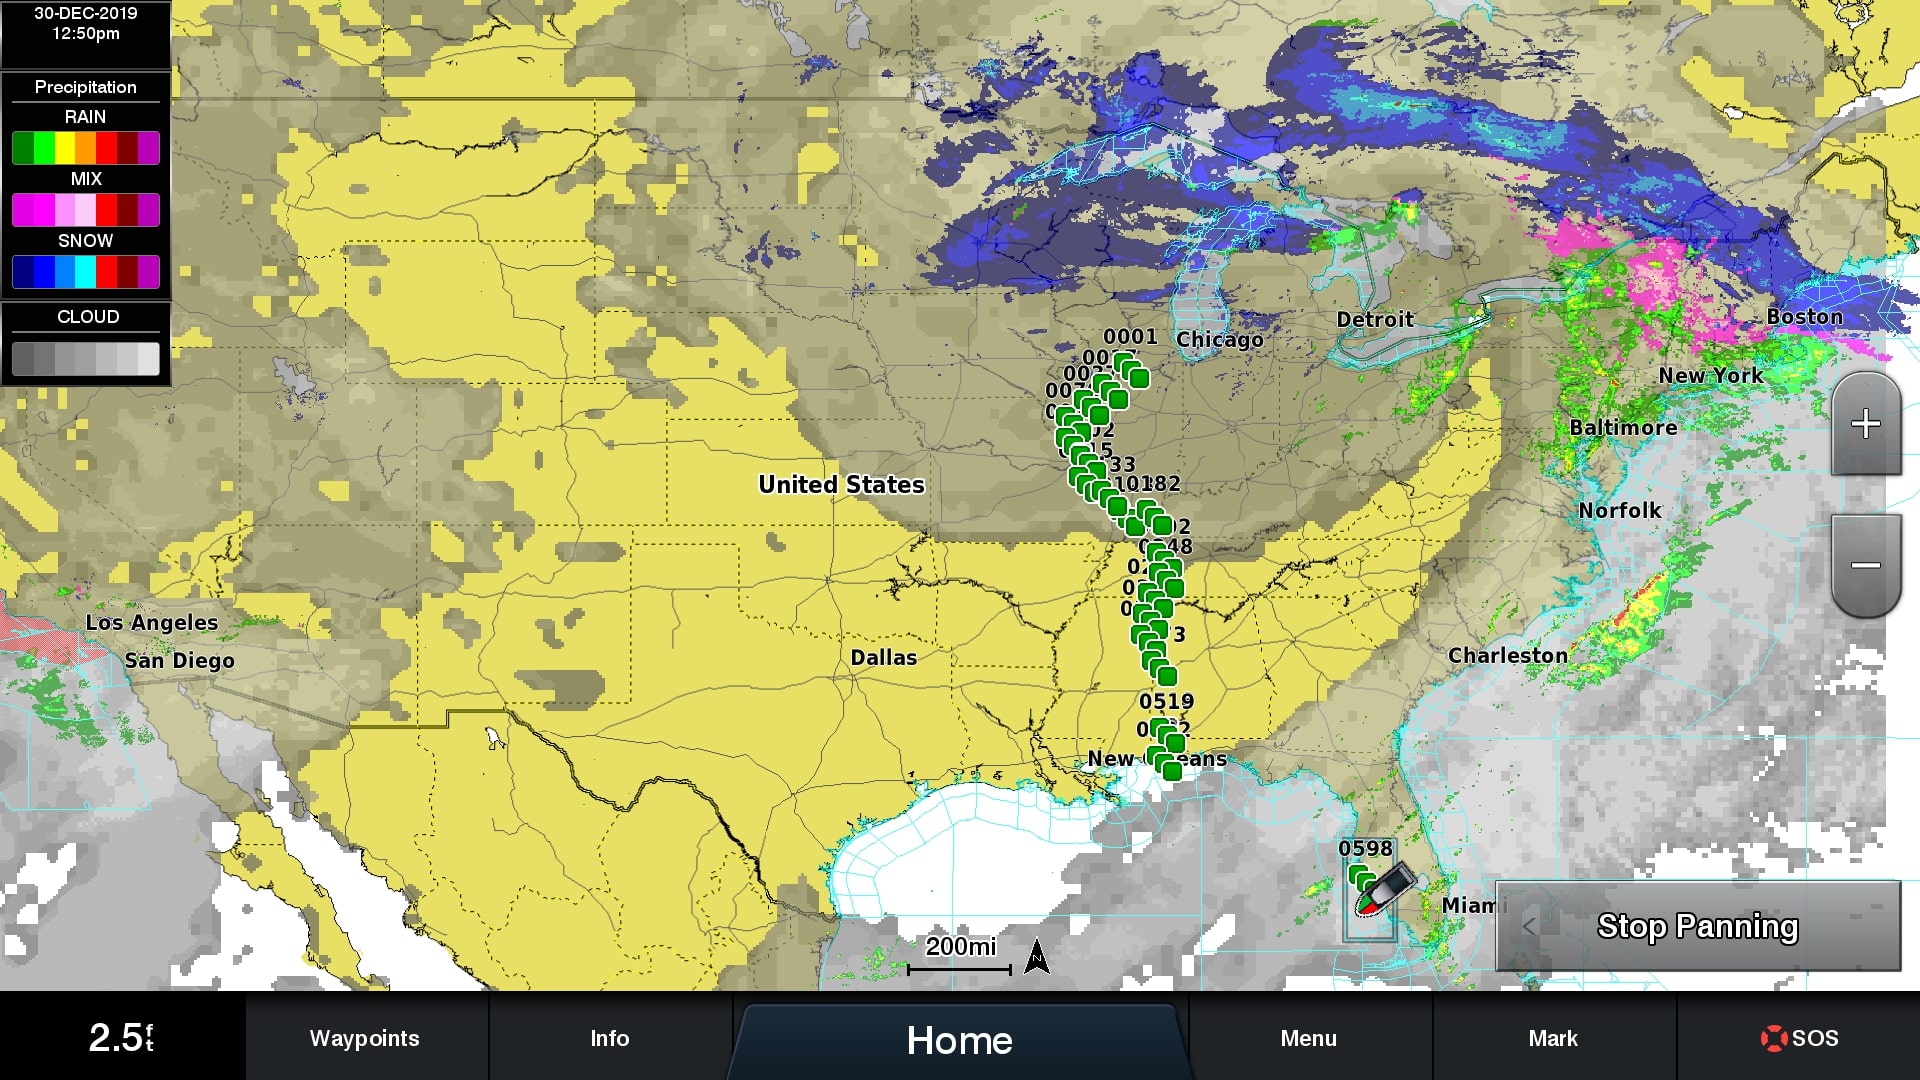
National weather radar showing precipitation 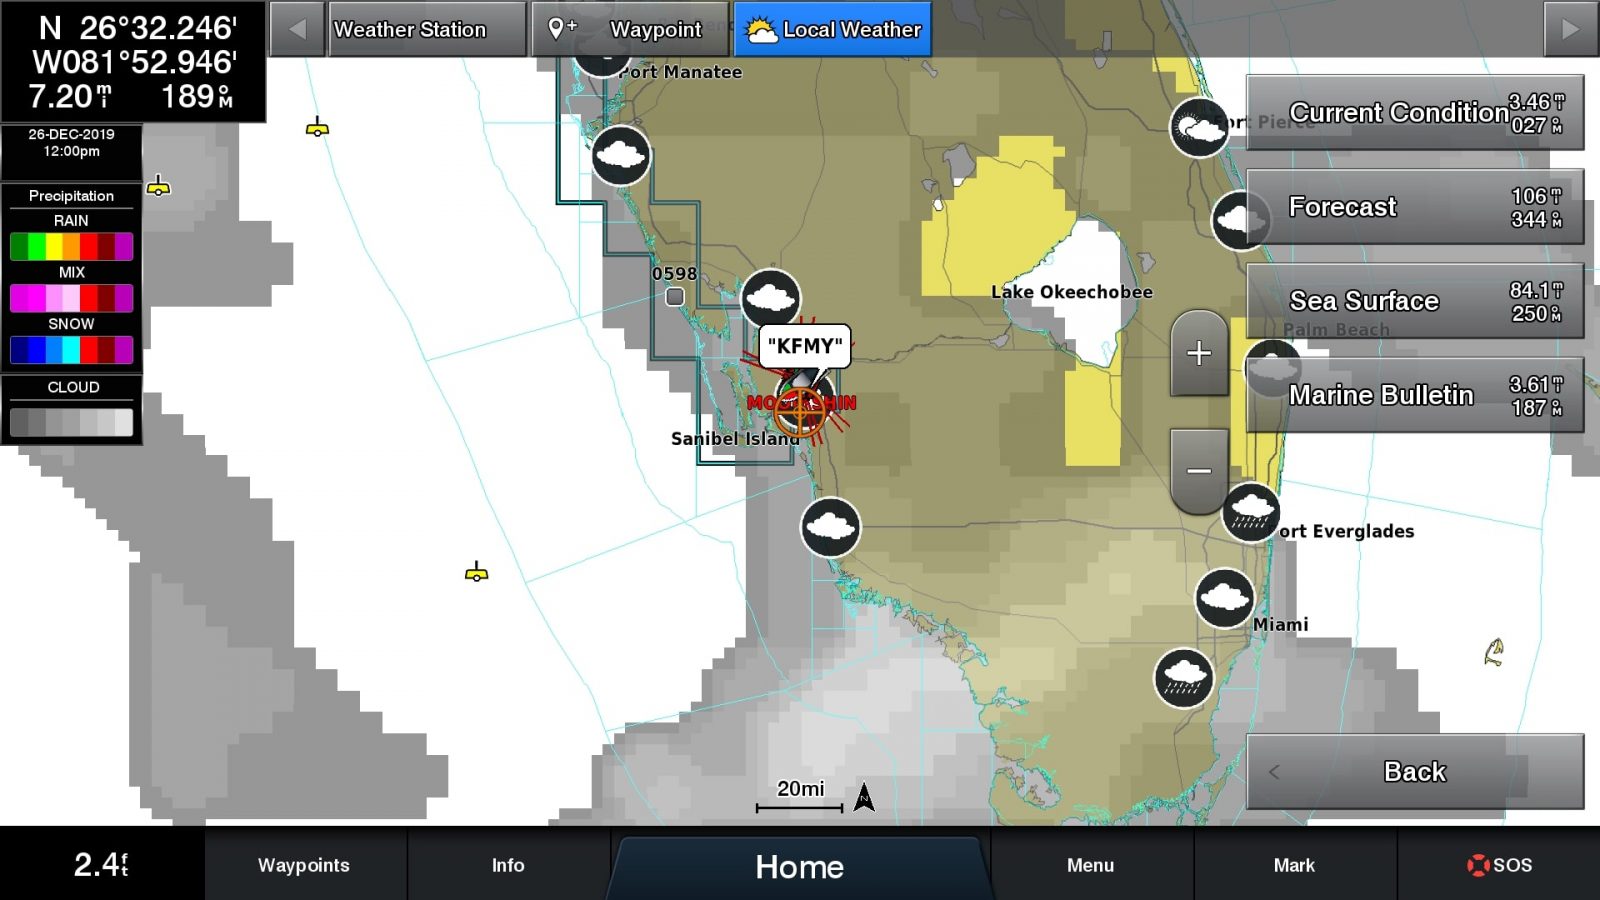
Context menu when a local forecast station is selected 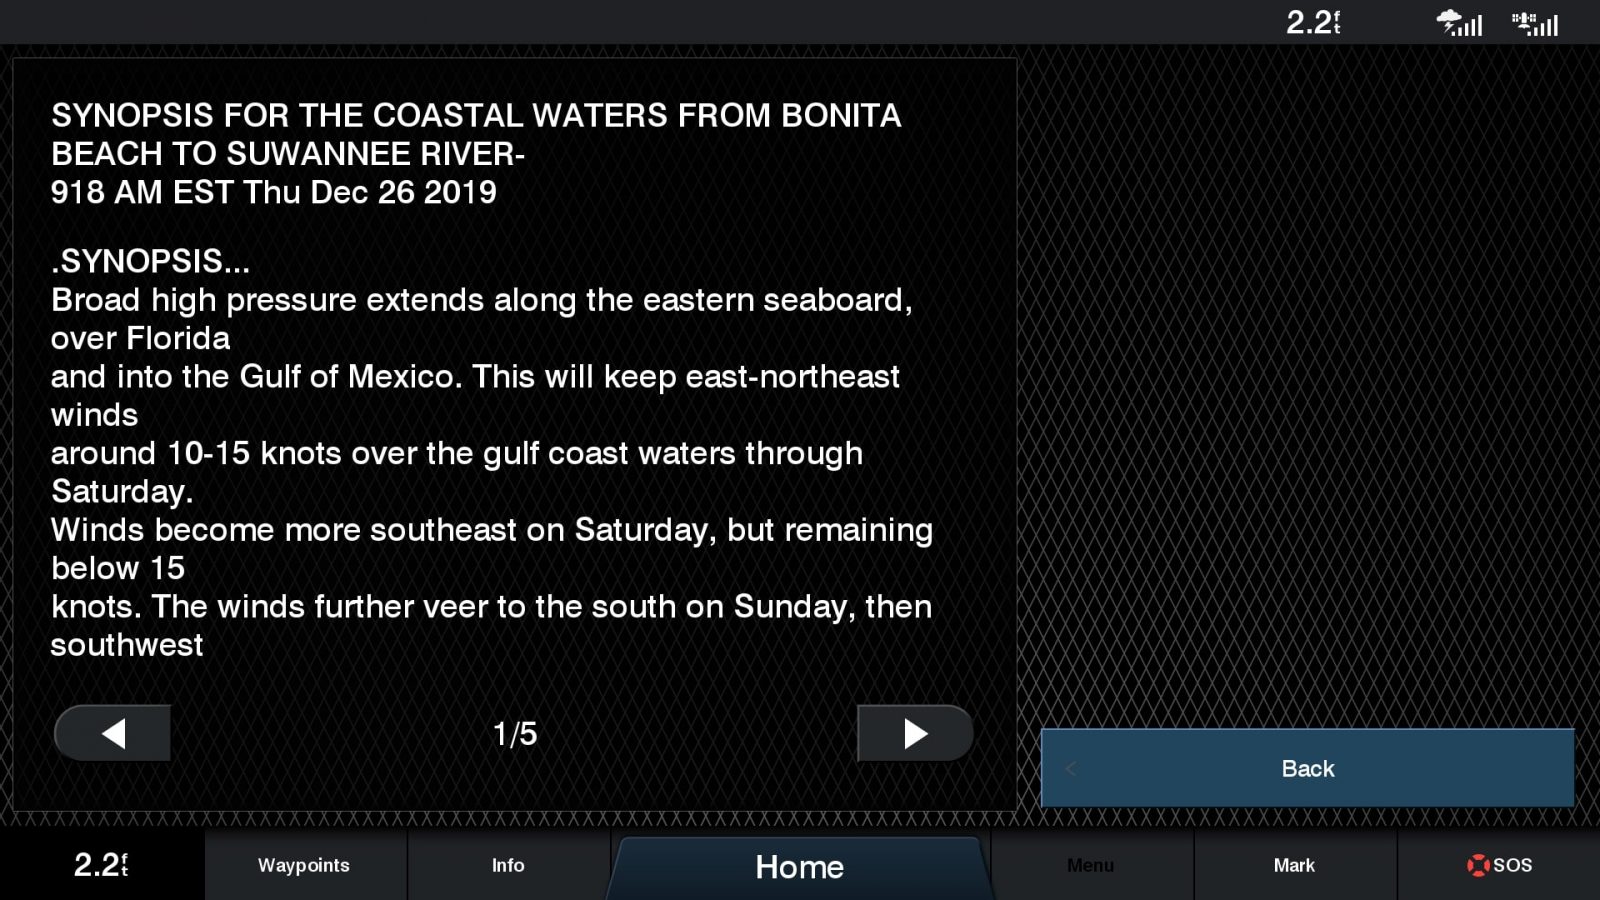
Zone forecast 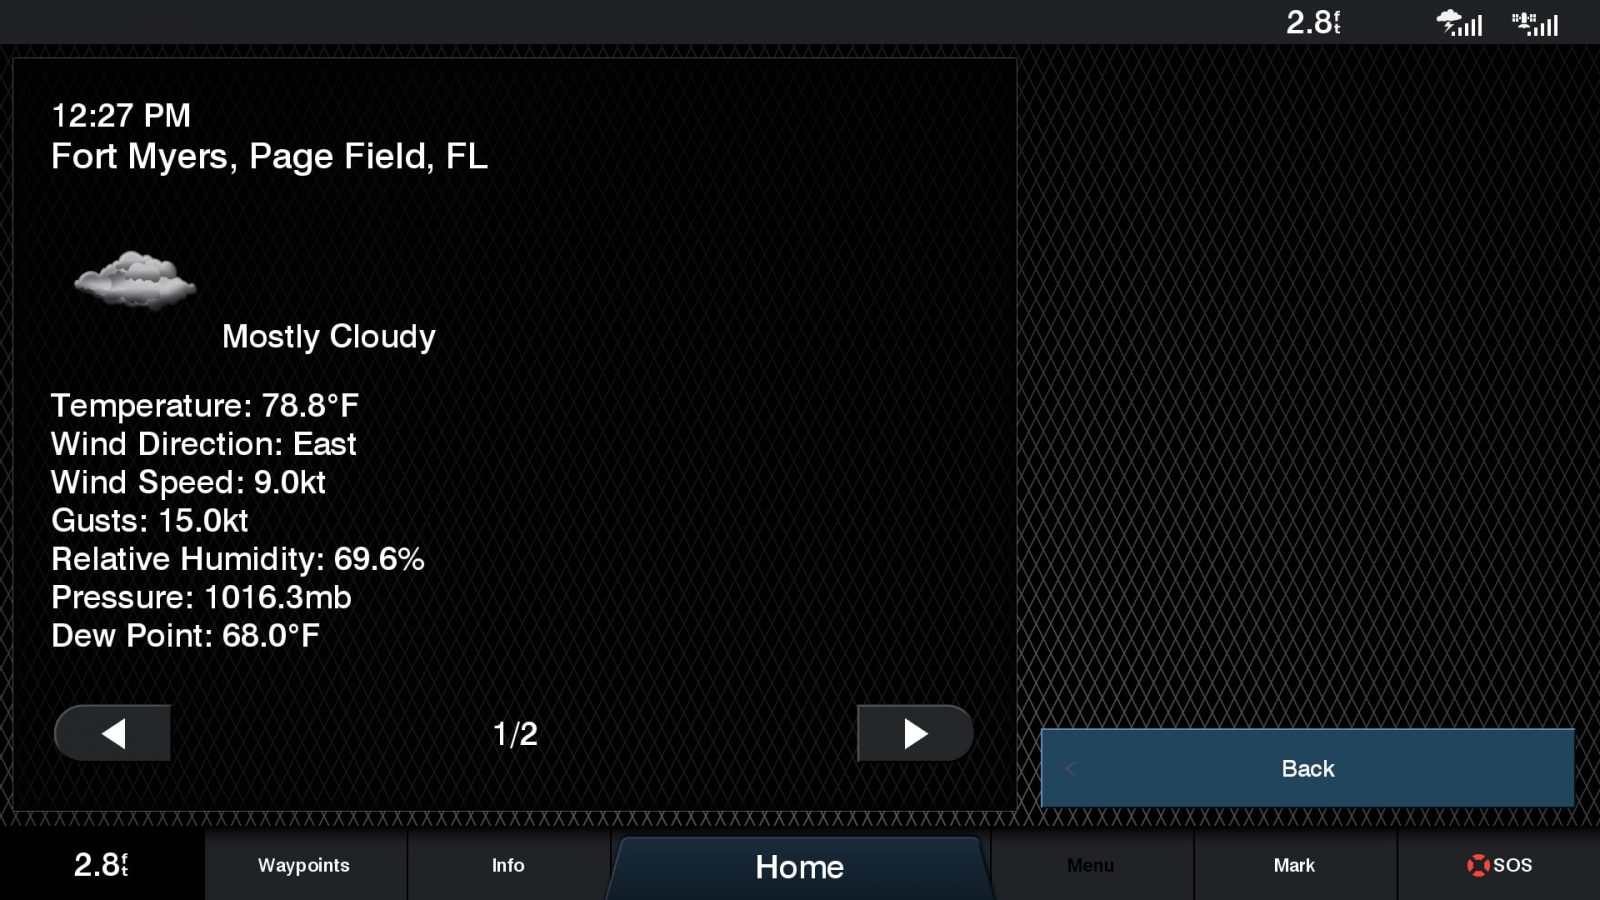
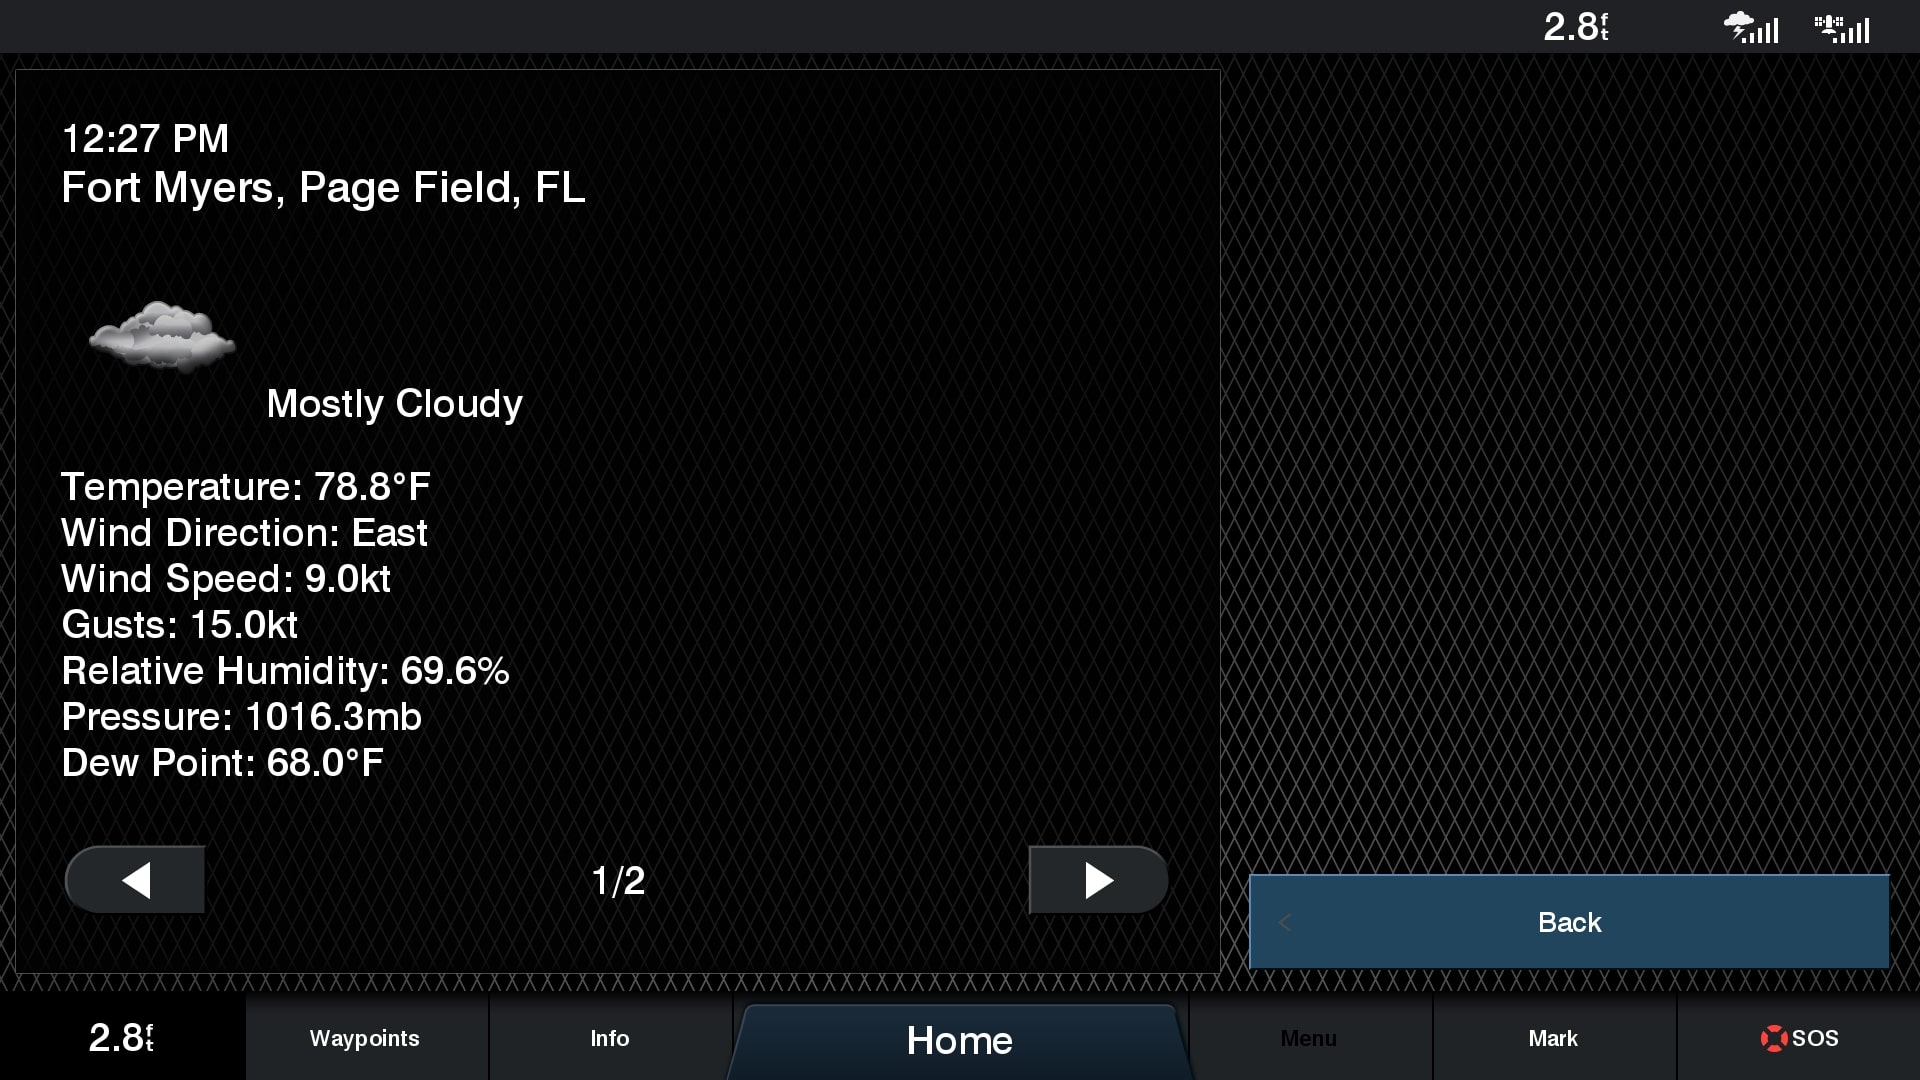
Local weather conditions 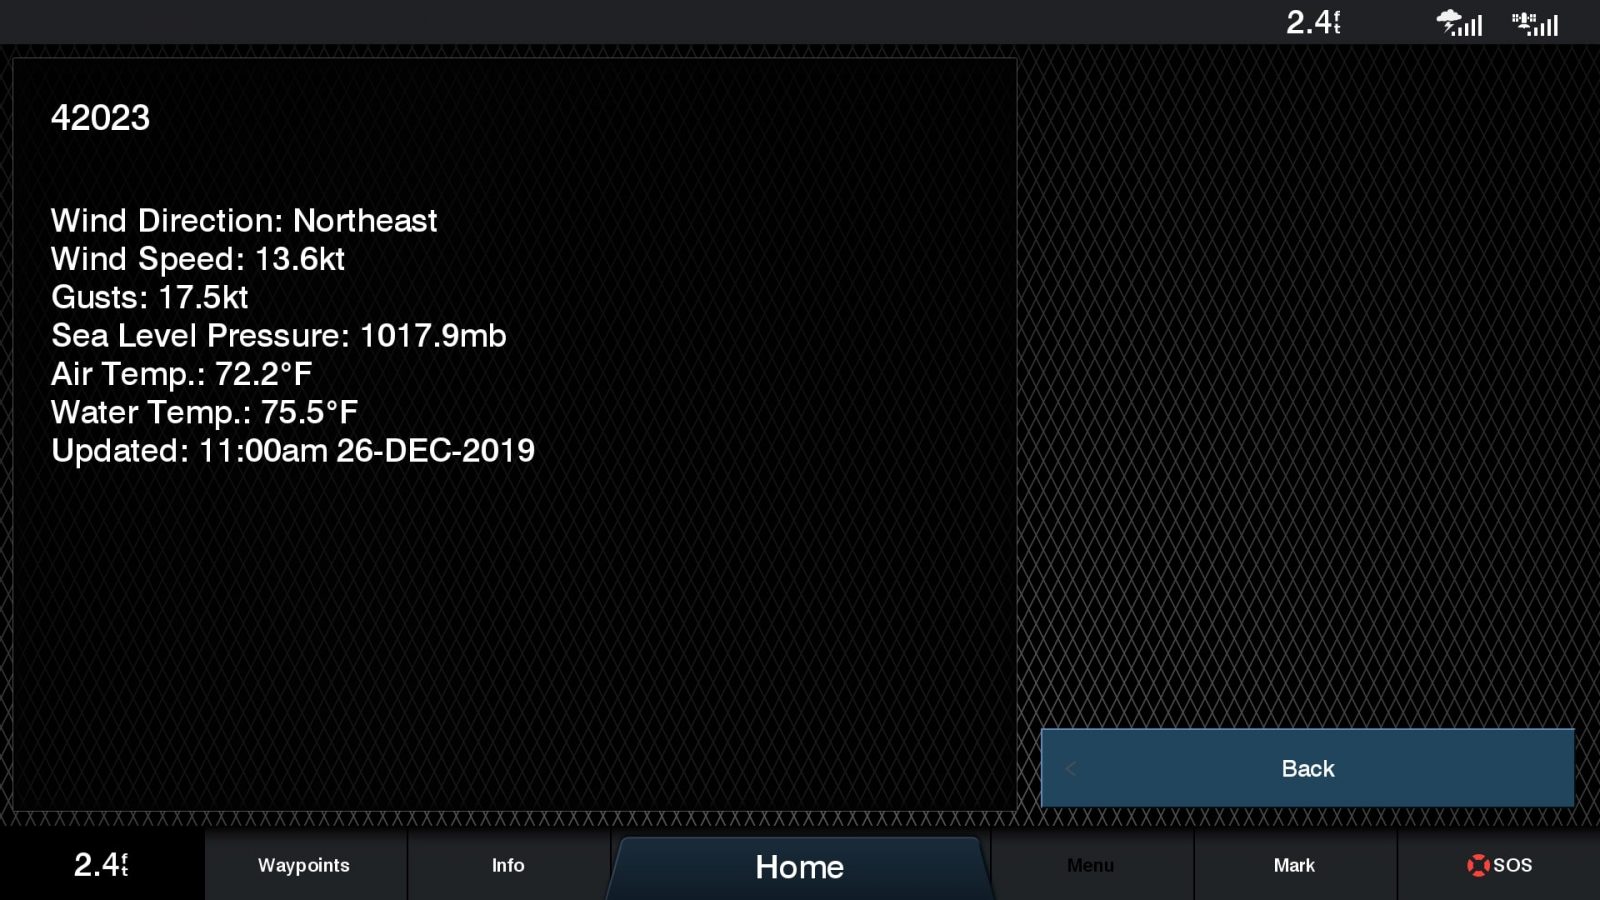
Buoy report

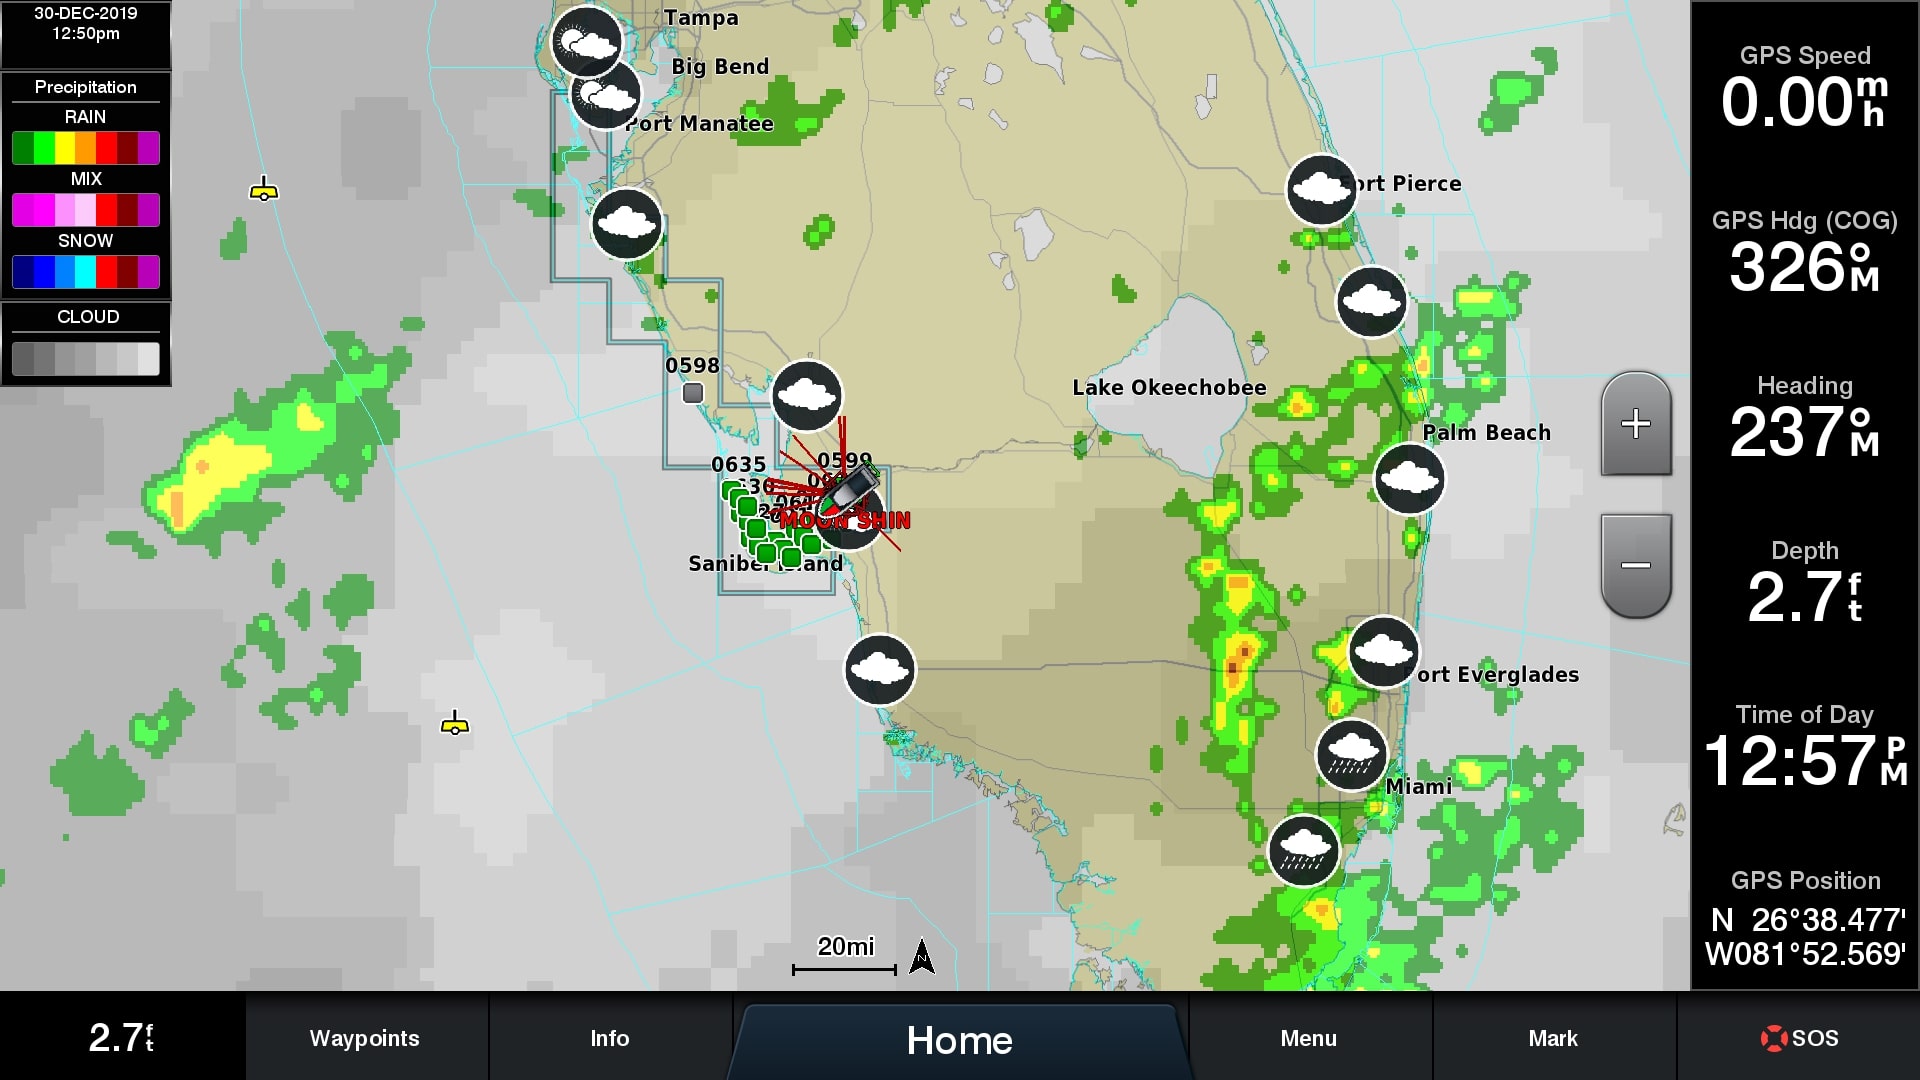
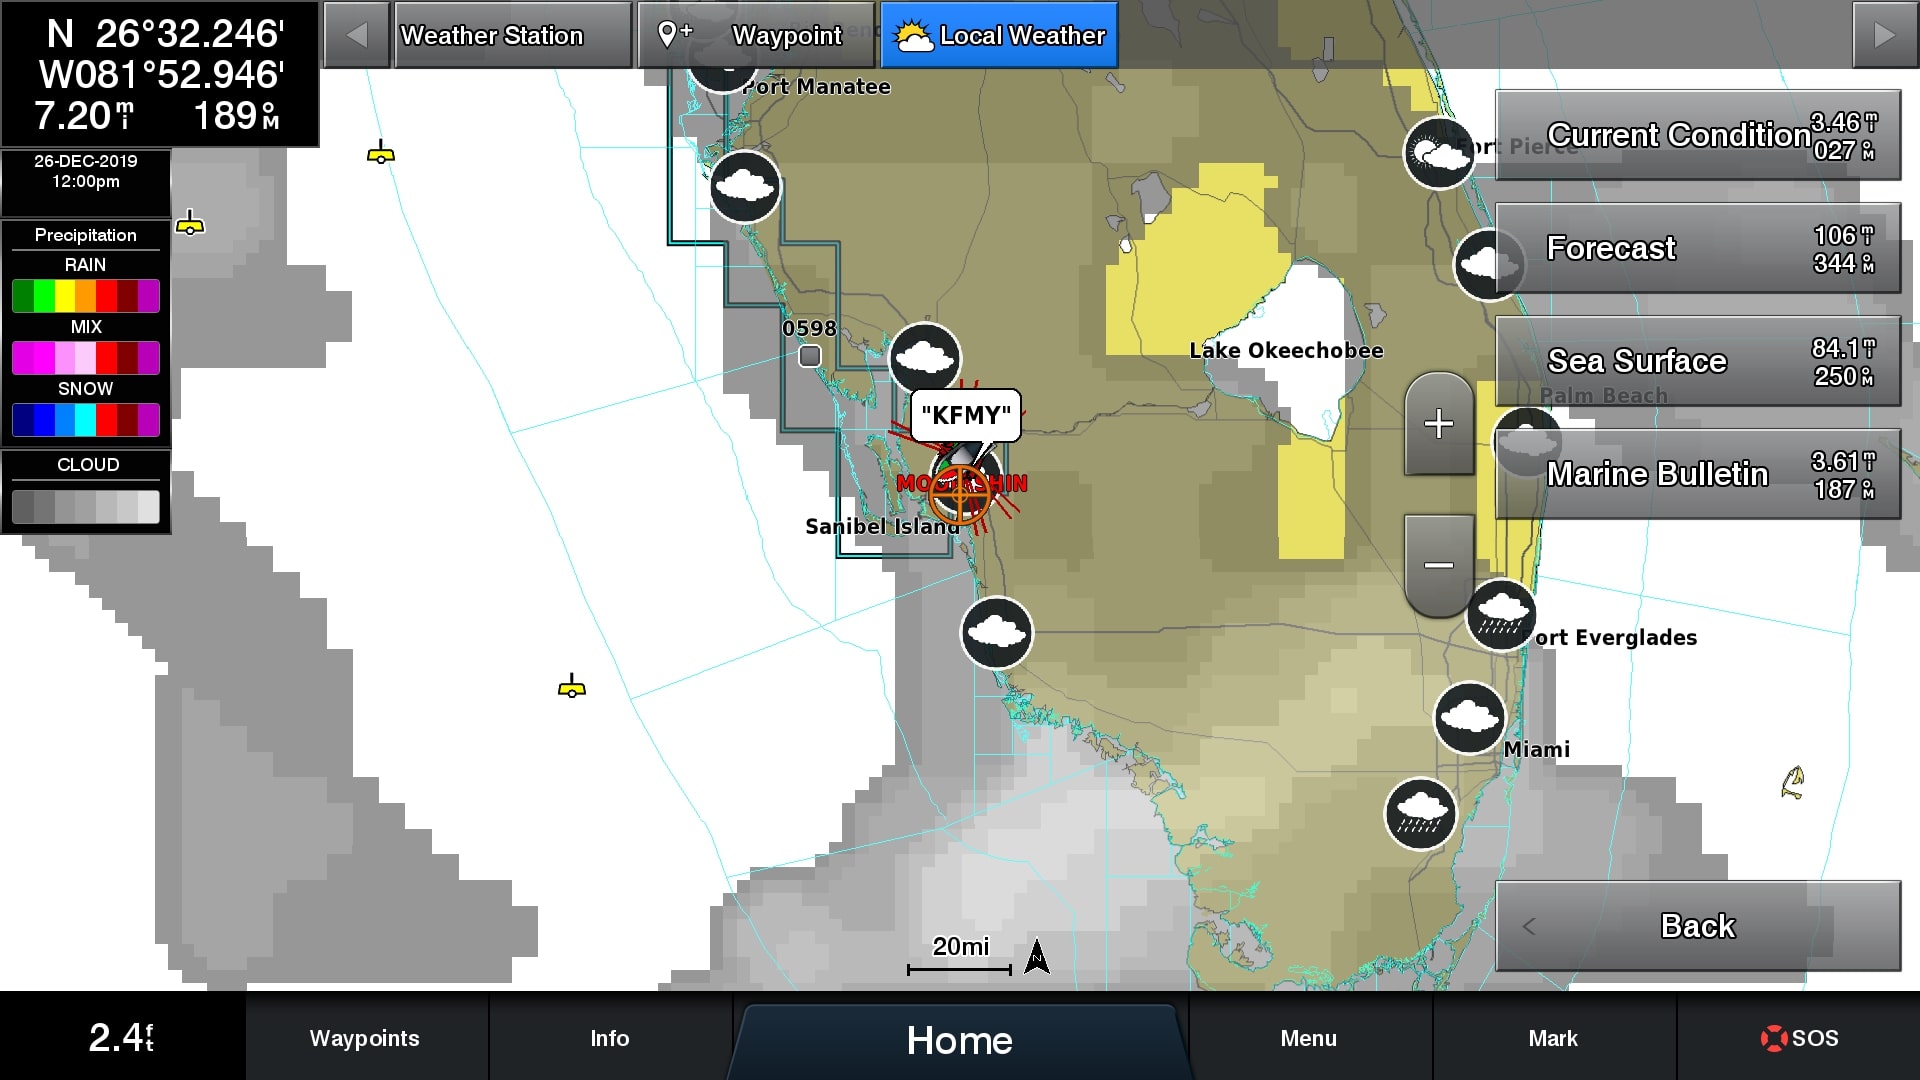


Fish Mapping also includes the full gamut of SiriusXM’s offshore weather package. SiriusXM weather delivers radar, storm, alerts, watches, wind, wave height, period and direction, atmospheric pressure isobars, lightning strikes, marine warnings and zone forecasts, buoy observations and sea surface temperatures. Weather radar data is updated every five minutes, lightning strike data every two and a half minutes, buoy reports every ten minutes, marine zone forecasts every 30 minutes, marine warnings hourly, and alerts as they’re issued. The remainder of the data is updated every three to six hours.
Different boaters will plan their trips differently, but it’s been my experience that I prefer to check weather and make planning decisions on a computer or tablet rather than on my MFD. As a result, I tend not to use SiriusXM weather in planning. But, once on the water, being able to receive weather updates, track storm systems, and receive alerts on an MFD at the helm is really valuable. Plus, the peace of mind knowing that I’ll receive weather updates regardless of cell service is great. For those who routinely run far offshore the combination of easily available data on your MFD and coverage of the entire continental US and 150 miles offshore is a formidable pairing.
Service plans
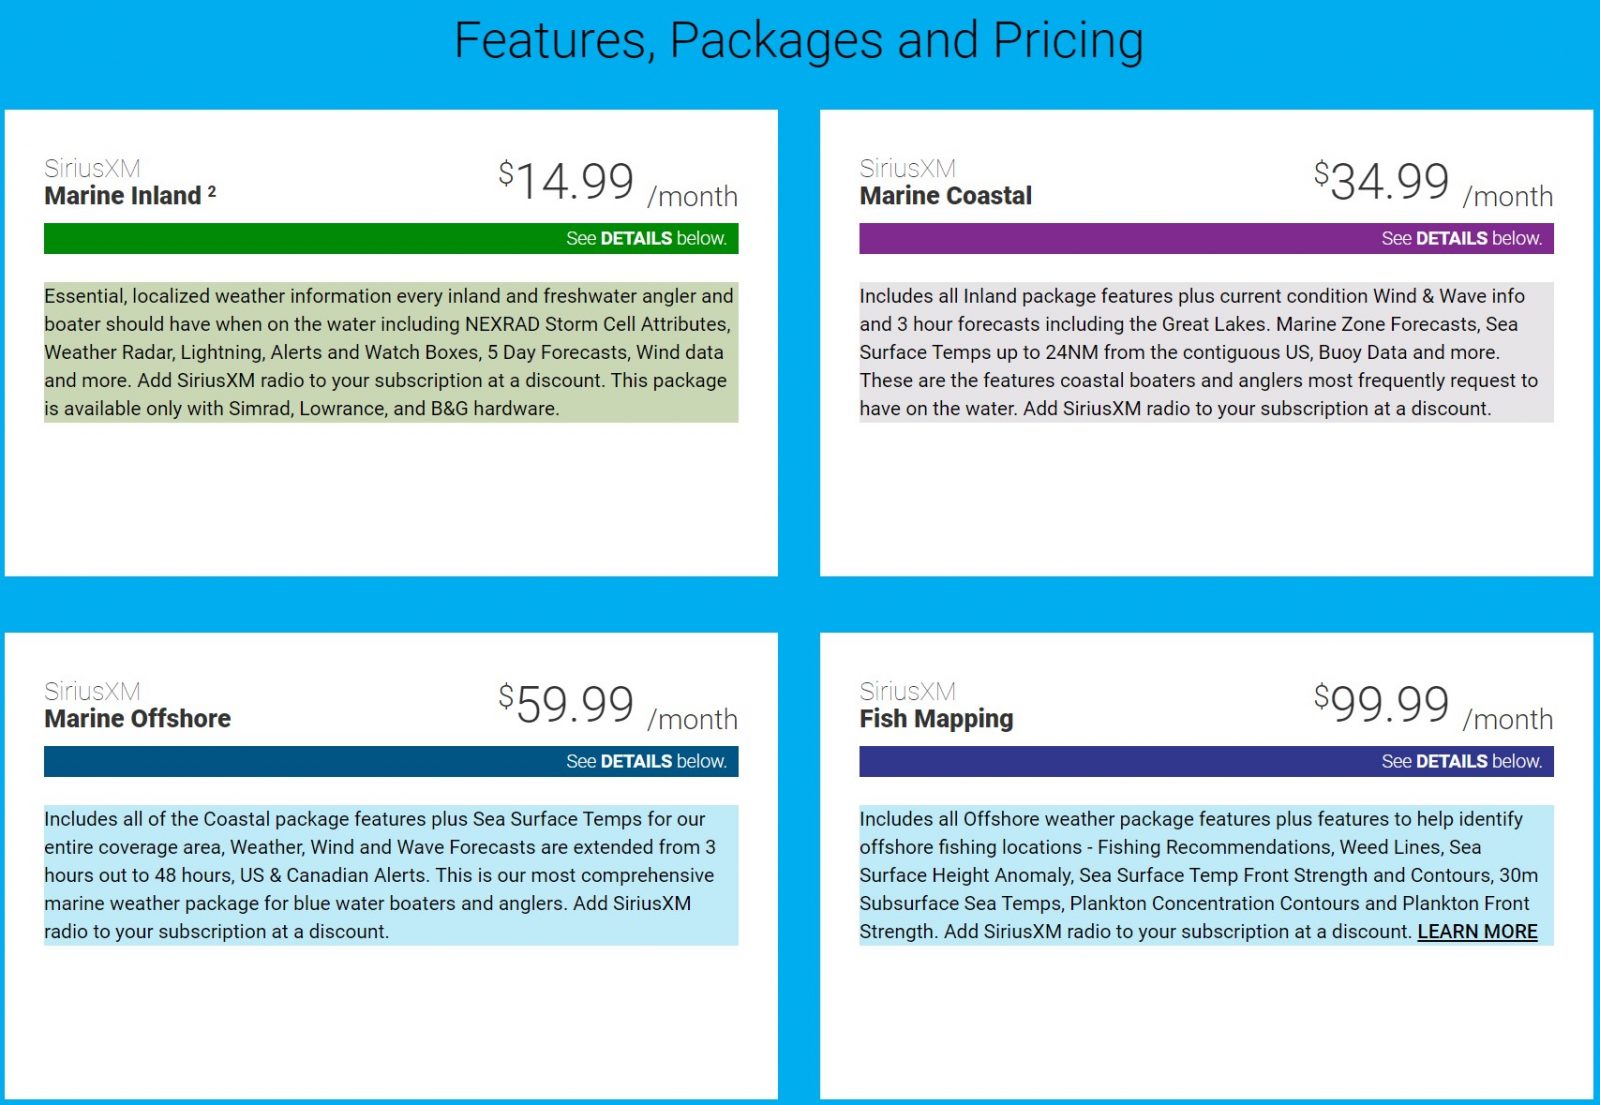
Coastal weather packages start at $35 per month and there’s a $15 per month option for freshwater inland coverage. Fish mapping starts at $100 per month, but that includes the weather coverage offered in the $60 offshore weather package. So, it’s $40 more a month for all the data in the Fish Mapping package.
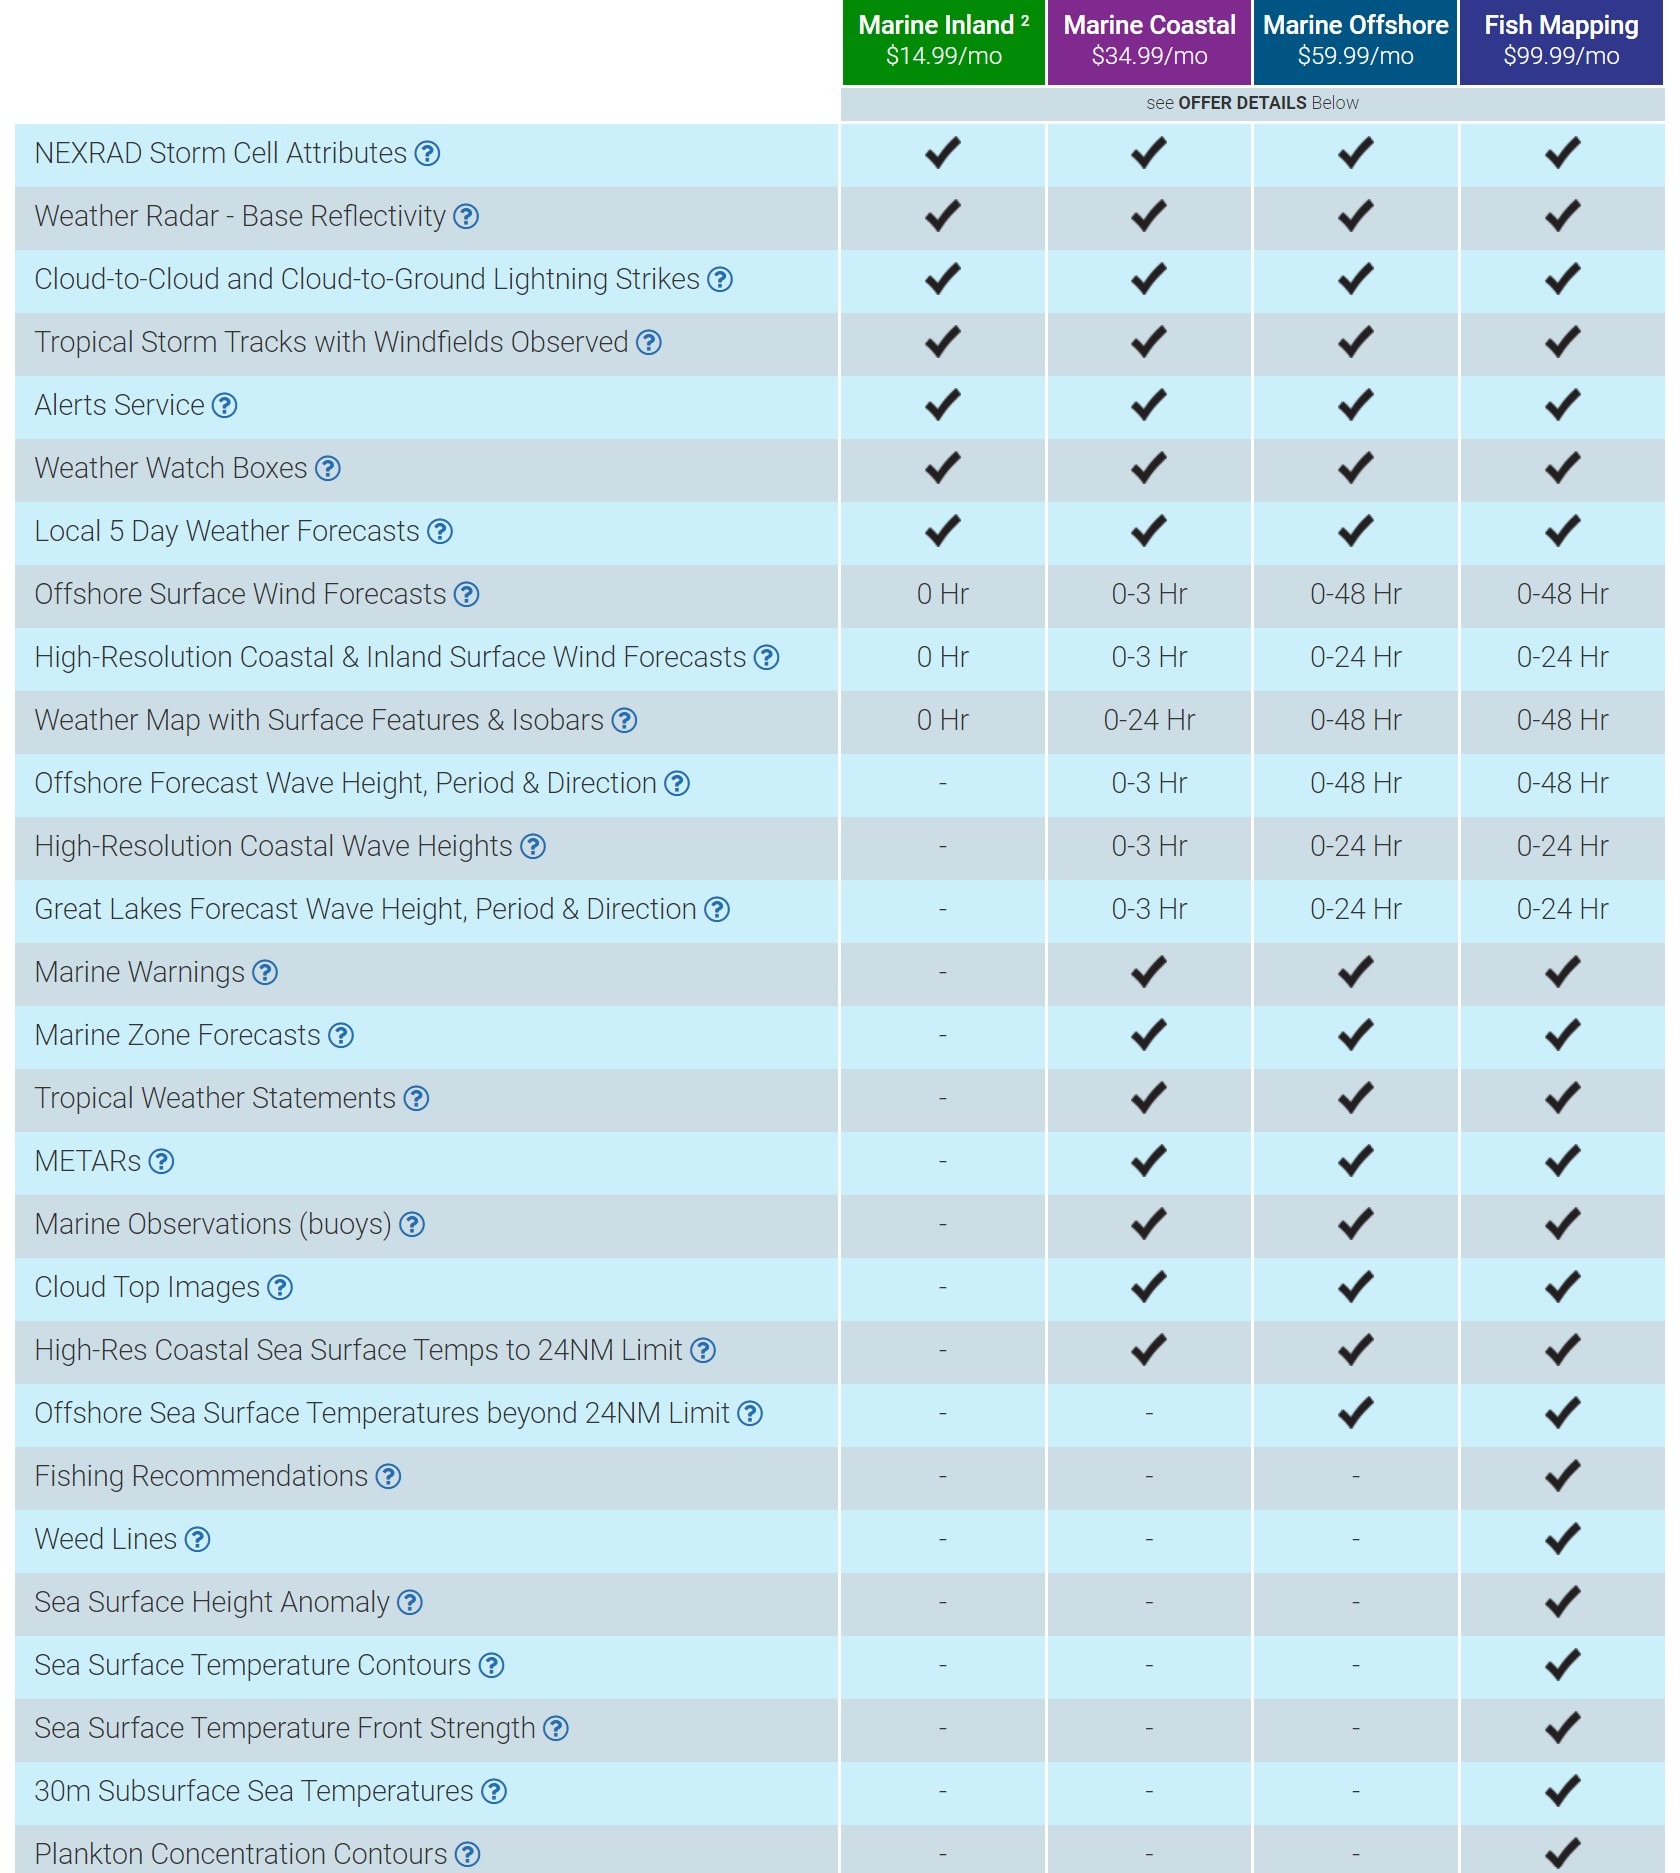
The primary difference between the Marine Coastal and Marine Offshore packages are the duration of the forecasts. For example, in Coastal the wind forecasts only extend out three hours, while in Offshore you get 48 hours of data. All SiriusXM packages can be suspended at no cost for up to 6 months at a time with a limit of two suspensions per year.
Final thoughts
As an incompetent angler there are likely nuances, good or bad, that I’m missing, but I thought Fish Mapping delivered a lot of information intuitively. If the information SiriusXM provides is relevant to your fishing, it seems to me that Fish Mapping and weather data delivered to your MFD may be an attractive package for $100 a month. While Garmin is the only manufacturer to have implemented Fish Mapping so far I expect others will follow soon. Garmin’s implementation of weather and Fish Mapping is intuitive and easy to use and together I think the pairing of Fish Mapping and Garmin’s equipment makes for an intriguing offering, easily presented on your MFD.


Recent Panbo Comments