Category: Charts

Raymarine LightHouse II, the paper chart lives on 21

Raymarine LightHouse II, the paper chart lives on

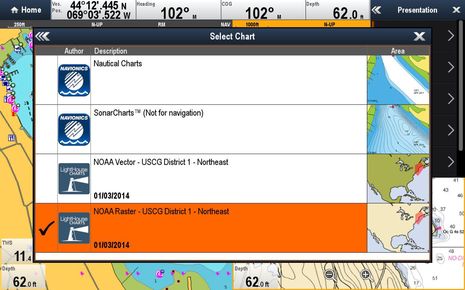
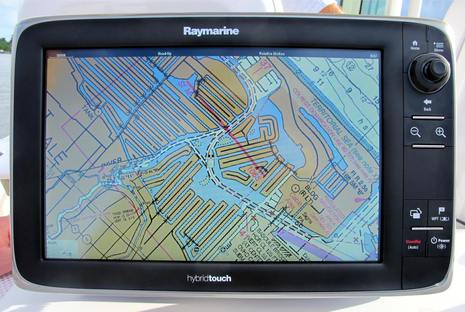
Raymarine_LightHouse_II_w_NOAA_raster_chart_cPanbo.jpgIsn’t it interesting that just after we learned that NOAA will no longer print traditional paper charts, Raymarine announced that all its current plotters will soon be able to use the digitized ‘raster’ equivalent of those same NOAA charts? The “completely redesigned LightHouse II” software that will make this entirely free new feature happen is due out in December, but I got on the water with a beta version last week. I was impressed with how well the raster charts looked and how well they panned and zoomed, even in beta, and there’s much more to like about LightHouse II…

NV-Charts app, plus MyNOAACharts & PDFs 25

NV-Charts app, plus MyNOAACharts & PDFs

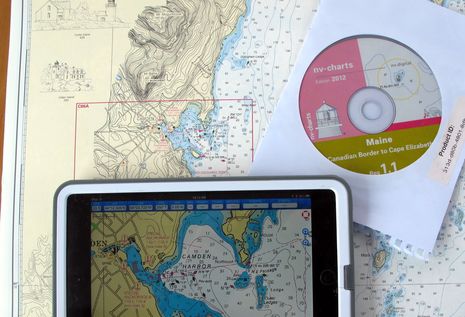
NV-Charts_paper_and_app_cPanbo.jpgNOAA’s Office of Coast Survey has been making news. We were just discussing changes to the Magenta Line on ICW charts when a reader (thanks, Collin) caught the announcement that OCS will stop printing traditional paper charts next April, which even got on NPR national radio. Charts lithographically printed on heavy paper are a beautiful technology and it hurts a bit to see them go, but I’m not it makes much practical difference. Personally I haven’t purchased one in long time (nor do I ever thrown them away) and I guess the mandatory carriage commercial vessels will do fine with print-on-demand charts and/or slowly proliferating ECDIS systems. At any rate, it seems like a good time to discuss how nicely the NV-Charts paper/digital package has evolved and also new ways that NOAA is distributing its cartography…

NOAA erases the Magenta Line, will crowdsourcing step up? 8

NOAA erases the Magenta Line, will crowdsourcing step up?

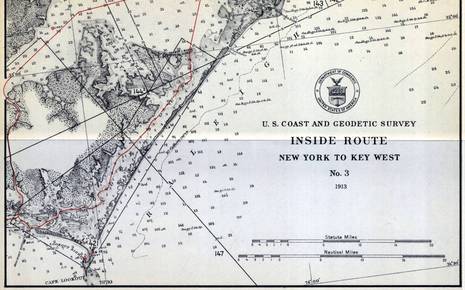
NOAA_Inside_Route__3_1913_cPanbo.jpgWhen Peter Swanson called to say he’d just become PassageMaker’s new editor-in-chief (which he’ll be great at, I think), the conversation soon turned to our strong mutual interests in cruising, electronics and charts. That’s how I finally learned that NOAA has started to remove the magenta chart lines that guide many users of the Intracoastal Waterway (ICW) and that they may never be replaced. Peter wrote about the issue in August, and NOAA recently put up a notably well-crafted Federal Register article that seeks more comments from the public. That’s where I learned that the brightly colored “recommended route lines” began on a 1913 chart series called the Inside Route Pilot — fascinating sample above, full size here — and that they haven’t been comprehensively updated since the 1930’s, when taxpayers spent a lot of money expanding the ICW (and creating jobs)…

Improved current data? Let the IHO know you care. 7

Improved current data? Let the IHO know you care.

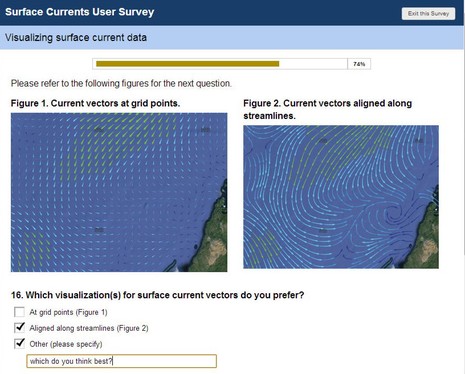
IHO_Surface_Current_Survey_page_cPanbo.jpgMaybe you too have an opinion about how predicted currents should be overlaid on electronic charts?  Well, the International Hydrographic Organization (IHO) is developing an S-100 specification for “the delivery and presentation of navigationally significant surface currents” and right now they’re running a online survey of all interested parties. What waters do you care about (coastal for me)? What prediction frequency would you like? Are you willing to pay? How should the data look? And more…

Onboard R/V Falkor, the Google “See Inside” way 6

Onboard R/V Falkor, the Google “See Inside” way

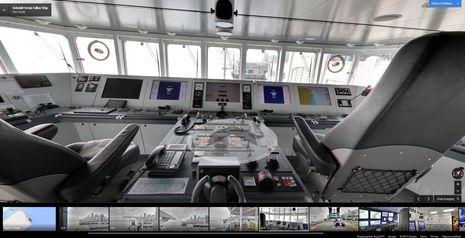
Google_Inside_RV_Falcor_helm_cPanbo.jpgI was blown away, partially due to the timing. Just after writing about how apps can make fascinating historical cartogrphy easily accessible, I learned about a fascinating advance in 21st century mapping. I’d guess that most every Panbo reader has marveled at the seamless panoramic photography found in Google Street Maps; well, now it’s possible to use very similar technology to tour inside a ship, and the vessel Google chose for the first demonstration is a corker…

Historical cartography, a Skipper app first? 3

Historical cartography, a Skipper app first?

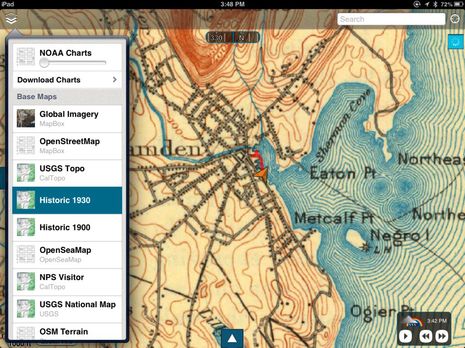
Skipper w historical topo basemap.jpgI was testing the new marine navigation app Skipper when I realized that historic topos were among the many “base maps” it can display along with regular NOAA raster charts. Skipper has some interesting features (to be covered soon), but I’ve been waiting a long time for this historic angle. Haven’t marine electronics and software become so powerful that they can help us with more than just the ‘work’ of operating a boat? As in my hopeful 2005 comment that “one day PC/plotter memory will be so abundant that historical charts will be included in navigation packages just for the fun of it!” Of course I didn’t realize then that tablet computers with wireless broadband Internet connections would come along, and aren’t they dandy for accessing the ever growing cloud of cartography?

Summer bummer, please don’t blame charts or electronics 46

Summer bummer, please don’t blame charts or electronics

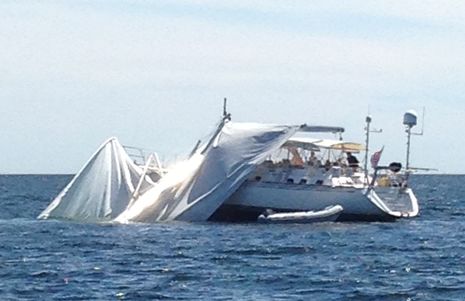
East_Goose_Rock_wreck_courtesy_Leonard_Lookner.jpgWhile my friend Leonard Lookner was first to come upon this bad scene Wednesday afternoon, he too was sailing and thus a powerboat just behind him was first to offer assistance. But it was Leonard’s iPhone photos that fueled a local PenBay Pilot news piece which then prompted an interesting SailNet discussion. Of course it was suggested that marine electronics or digital charts were somehow to blame, allegations I’d like to refute, and I also want to report on how how well this worse-than-it-even-looks situation actually turned out. Plus getting reminded to be careful out there is never a bad idea…

C-Maps in Coastal Explorer, never enough charts! 12

C-Maps in Coastal Explorer, never enough charts!

Gizmo_lower_helm_April_2013_cPanbo.jpg

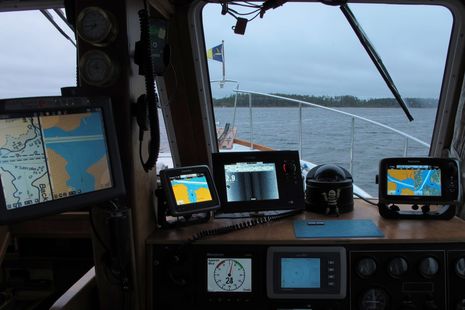
Yes, it sure looks like overkill — and this shot doesn’t even include the iPad that’s often mounted here at Gizmo’s lower helm — but I’ve definitely found ways to put all these screens to work. In this particular scene the boat is crawling out of a very shallow back creek (actually called Back Creek) where we’d hidden from the worst of a cold gusty low that had me wondering if spring would ever materialize. It was still gusting in the high 20’s and that’s only 2.8 feet under the StructureScan transducer that’s fastened to the keel forward. If you look closely you’ll see many chart types, including the C-Map Max format now well supported by Coastal Explorer. The day before I’d gotten a serious reminder about the value of multi charting…

USS Guardian aground, DNC chart error? 97

USS Guardian aground, DNC chart error?

USS_Guardian_on_Tubbahata_courtesy_AFP_Western_Command.jpg

I’ve heard of hitting “the bricks” as in going hard aground — as well as “bricking” a computer (or other gadget), as in breaking it so badly that it’s only good for a door stop — but gCaptain surprised me with “USS Guardian is Fully Bricked Up and Getting Battered on Philippine Reef.” The situation is even worse since the minesweeper swung 90 degrees and is getting so hammered that it’s hard to imagine how it can be removed from the tiny Tubbahata Reefs National Park. Thankfully no one was hurt (to my knowledge) but I’m probably thinking about terminology because it’s horrible to contemplate what those pictures imply about the damage to ship, reputations, and — most important — precious wildlife. How could this happen?

NV-Charts on Navico displays, another ‘paper’ option! 22

NV-Charts on Navico displays, another ‘paper’ option!

NV-Charts_on_Lowrance_HDS.jpg

The surprising press release just came in. I didn’t even know that Navico multifunction displays could handle “raster” style digital charts — the ones that look like paper charts — let alone that NV Charts was working to make its large portfolio of handsome cartography available to the owners of Lowrance HDS, Simrad NSE/NSO/NSS, and B&G Zeus MFDs…